8th Jan 2026
Redesigned share links for ideas and campaignsShare links now feature a cleaner, more modern design that matches the in-app experience.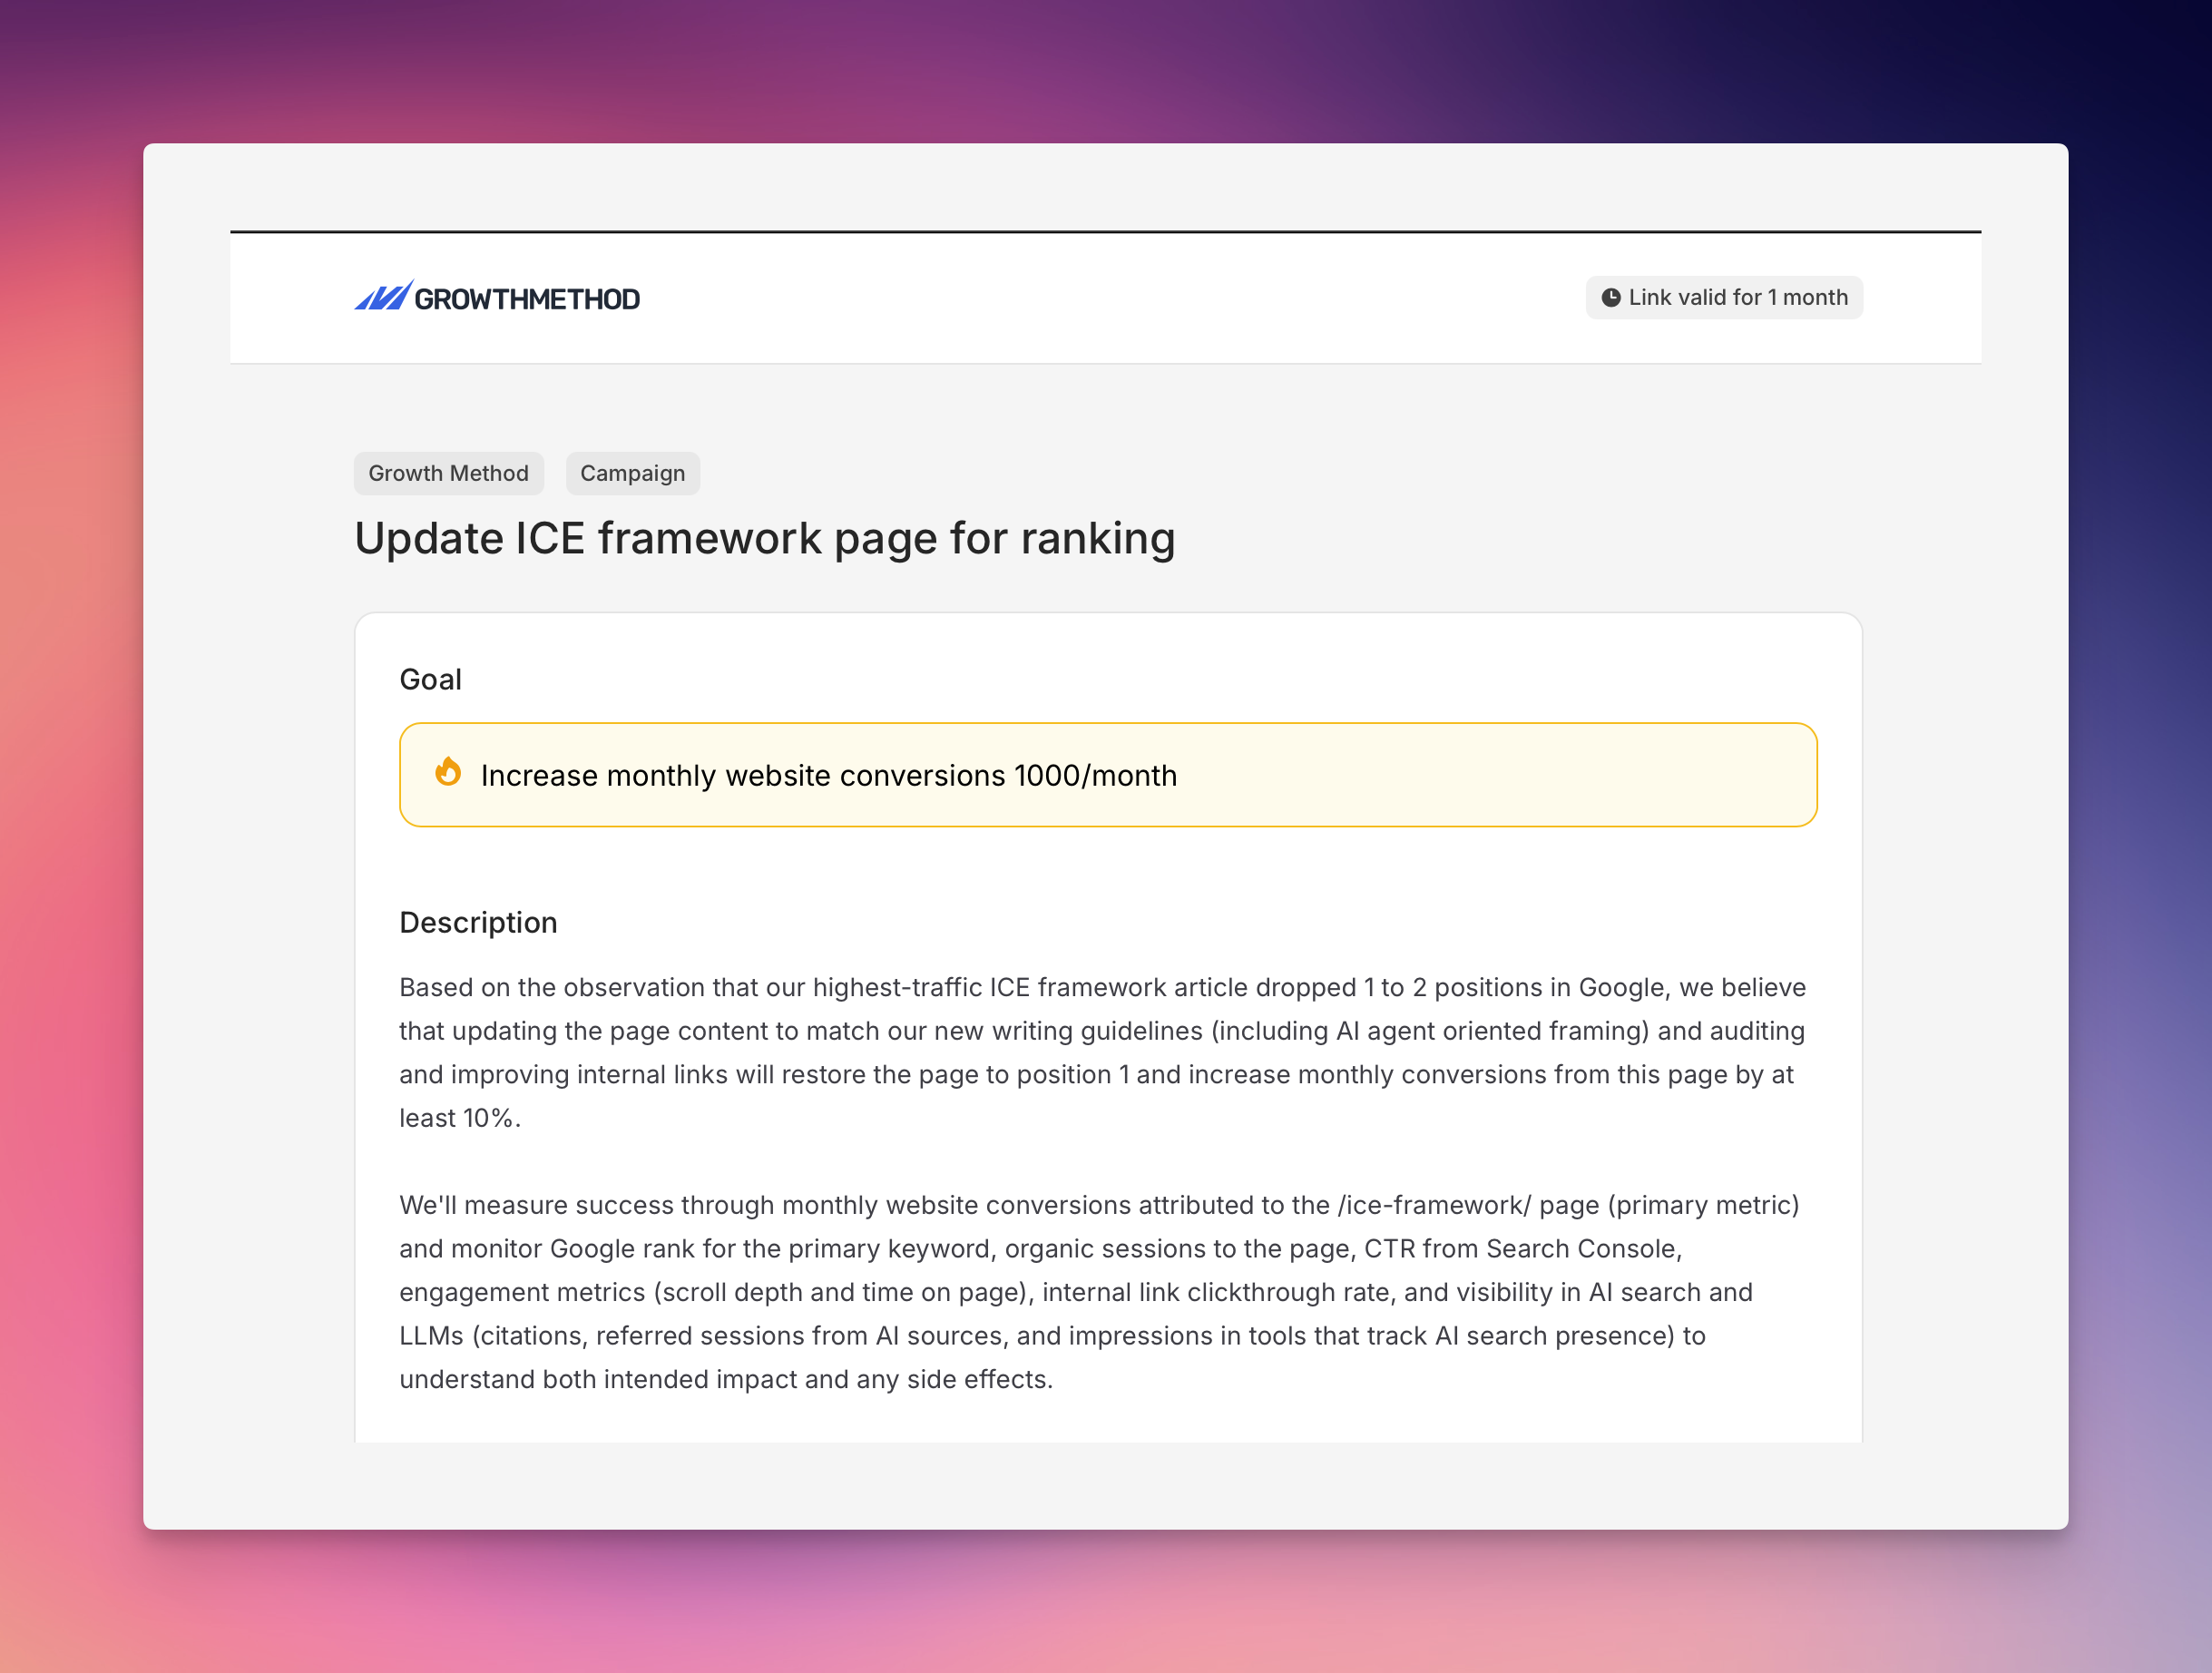
- Consistent styling with the main application using Flux components
- Cleaner layout with a white content area on light grey background
- Professional appearance using black, white, and grey color scheme
- Better branding with properly sized Growth Method logo
- Improved readability across all shared campaign and idea pages
8th Jan 2026
Fixed search results display issueThe search functionality (accessible via the navigation bar or Command+K) now correctly displays search results without showing a confusing “No results found” message.Previously, when searching for items, the “No results found” text would incorrectly appear alongside actual search results, particularly on the first search attempt. This was caused by duplicate empty state handling between custom code and the UI component library.Search now works reliably, showing only your results when matches are found and the appropriate empty state only when there truly are no matches.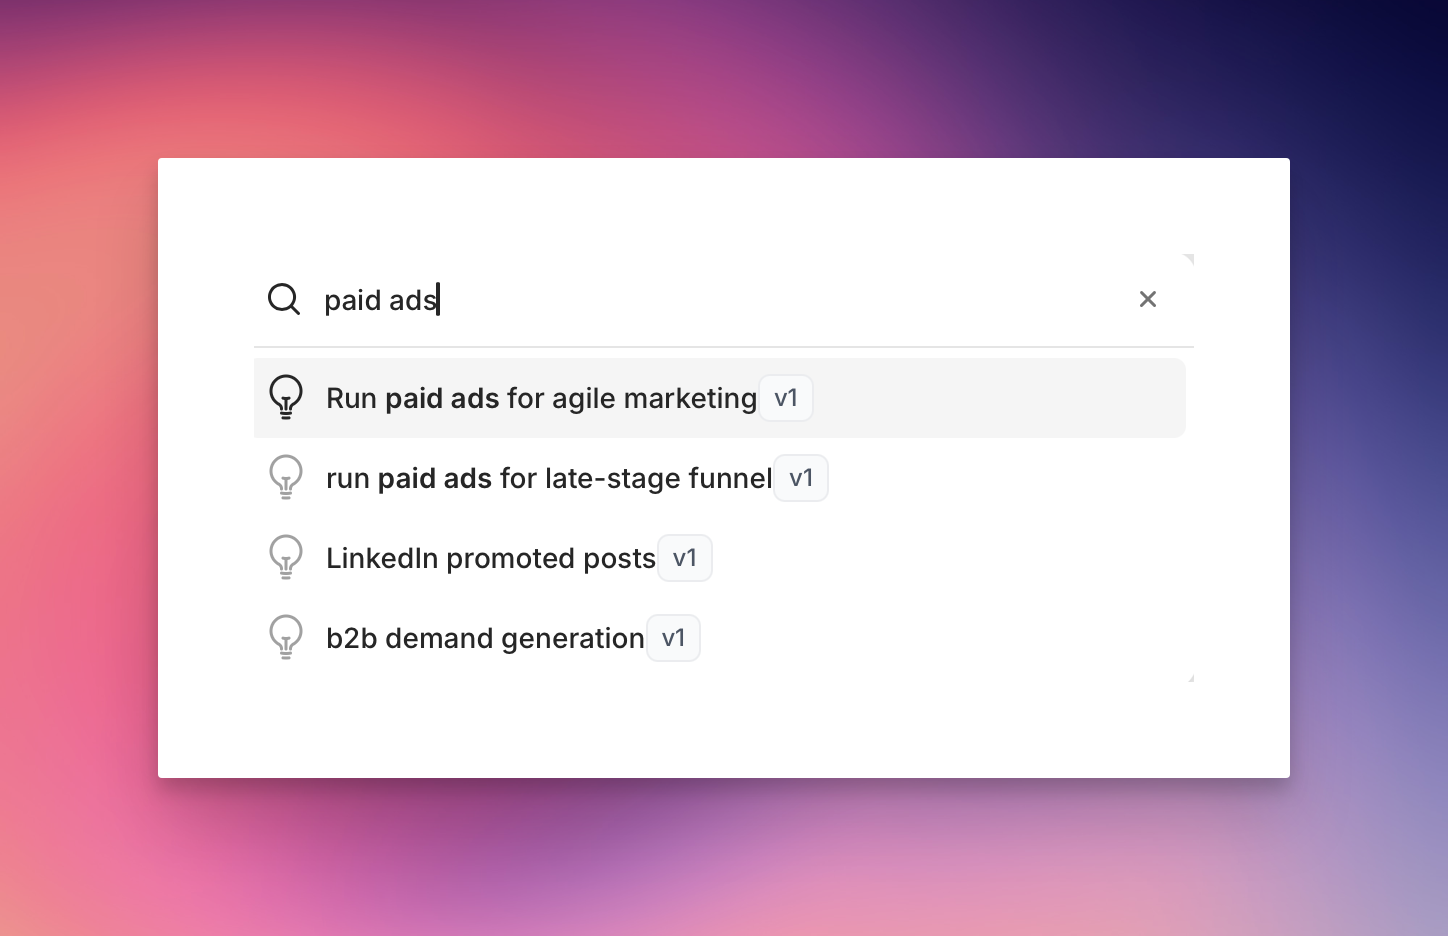
6th Jan 2026
Better positioned score tooltipsScore tooltips on idea and campaign pages now appear below the score instead of above it.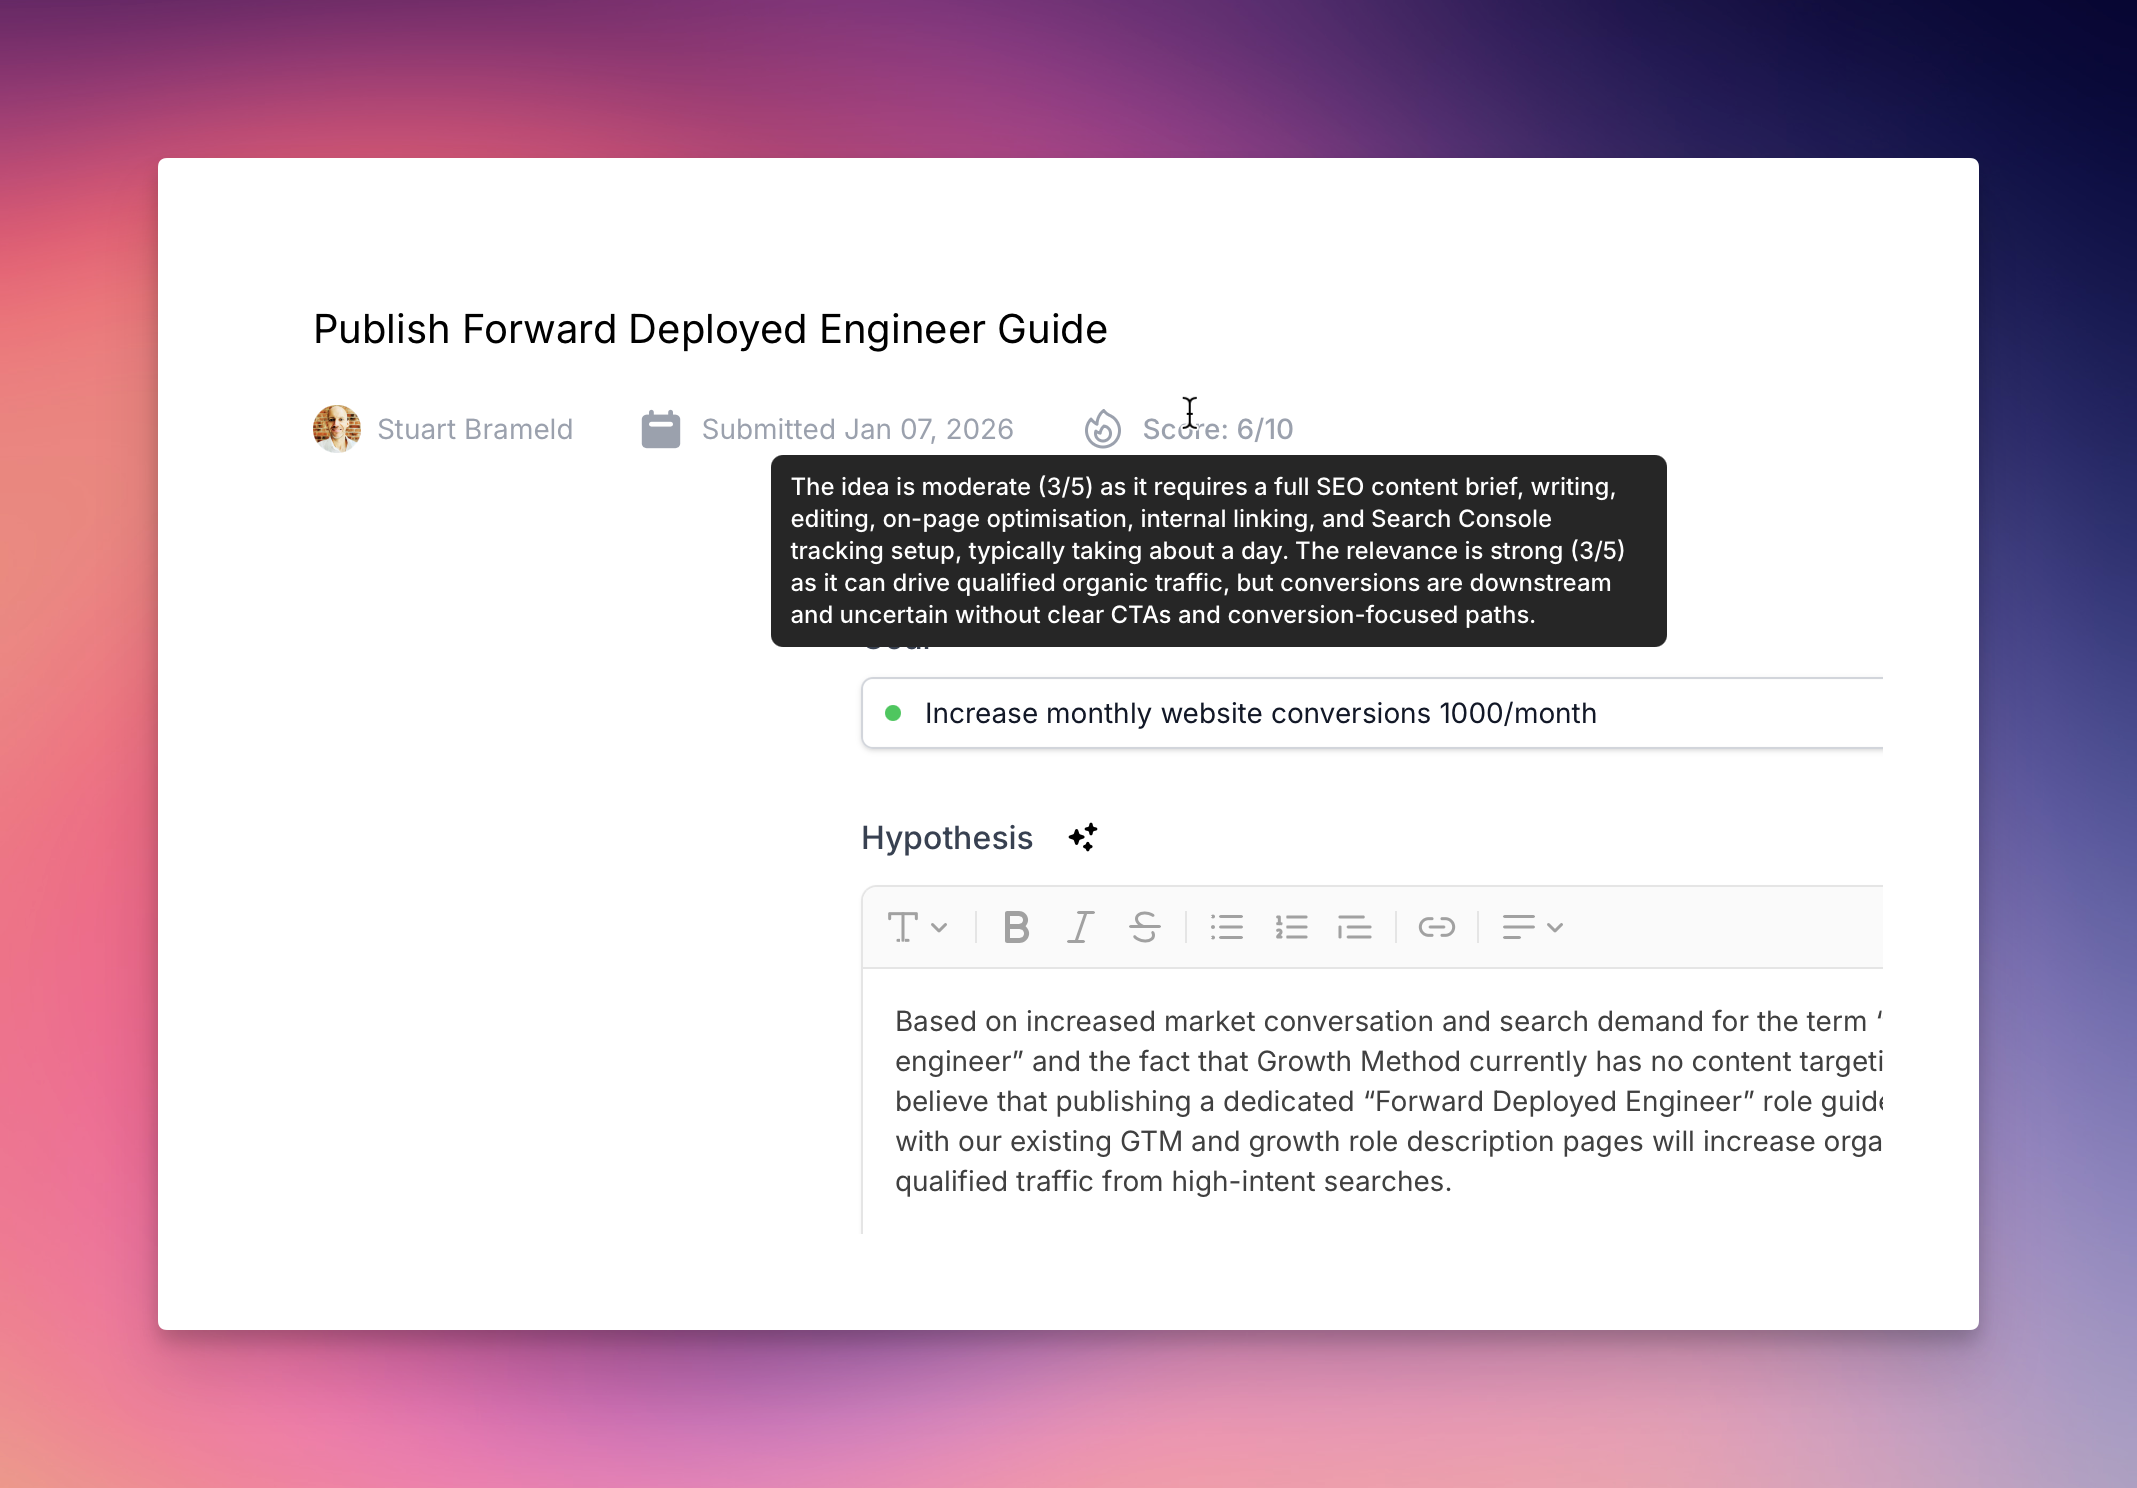
4th Jan 2026
Fixed hypothesis builder text extractionWhen creating an idea from the hypothesis builder, only the relevant hypothesis content is now included.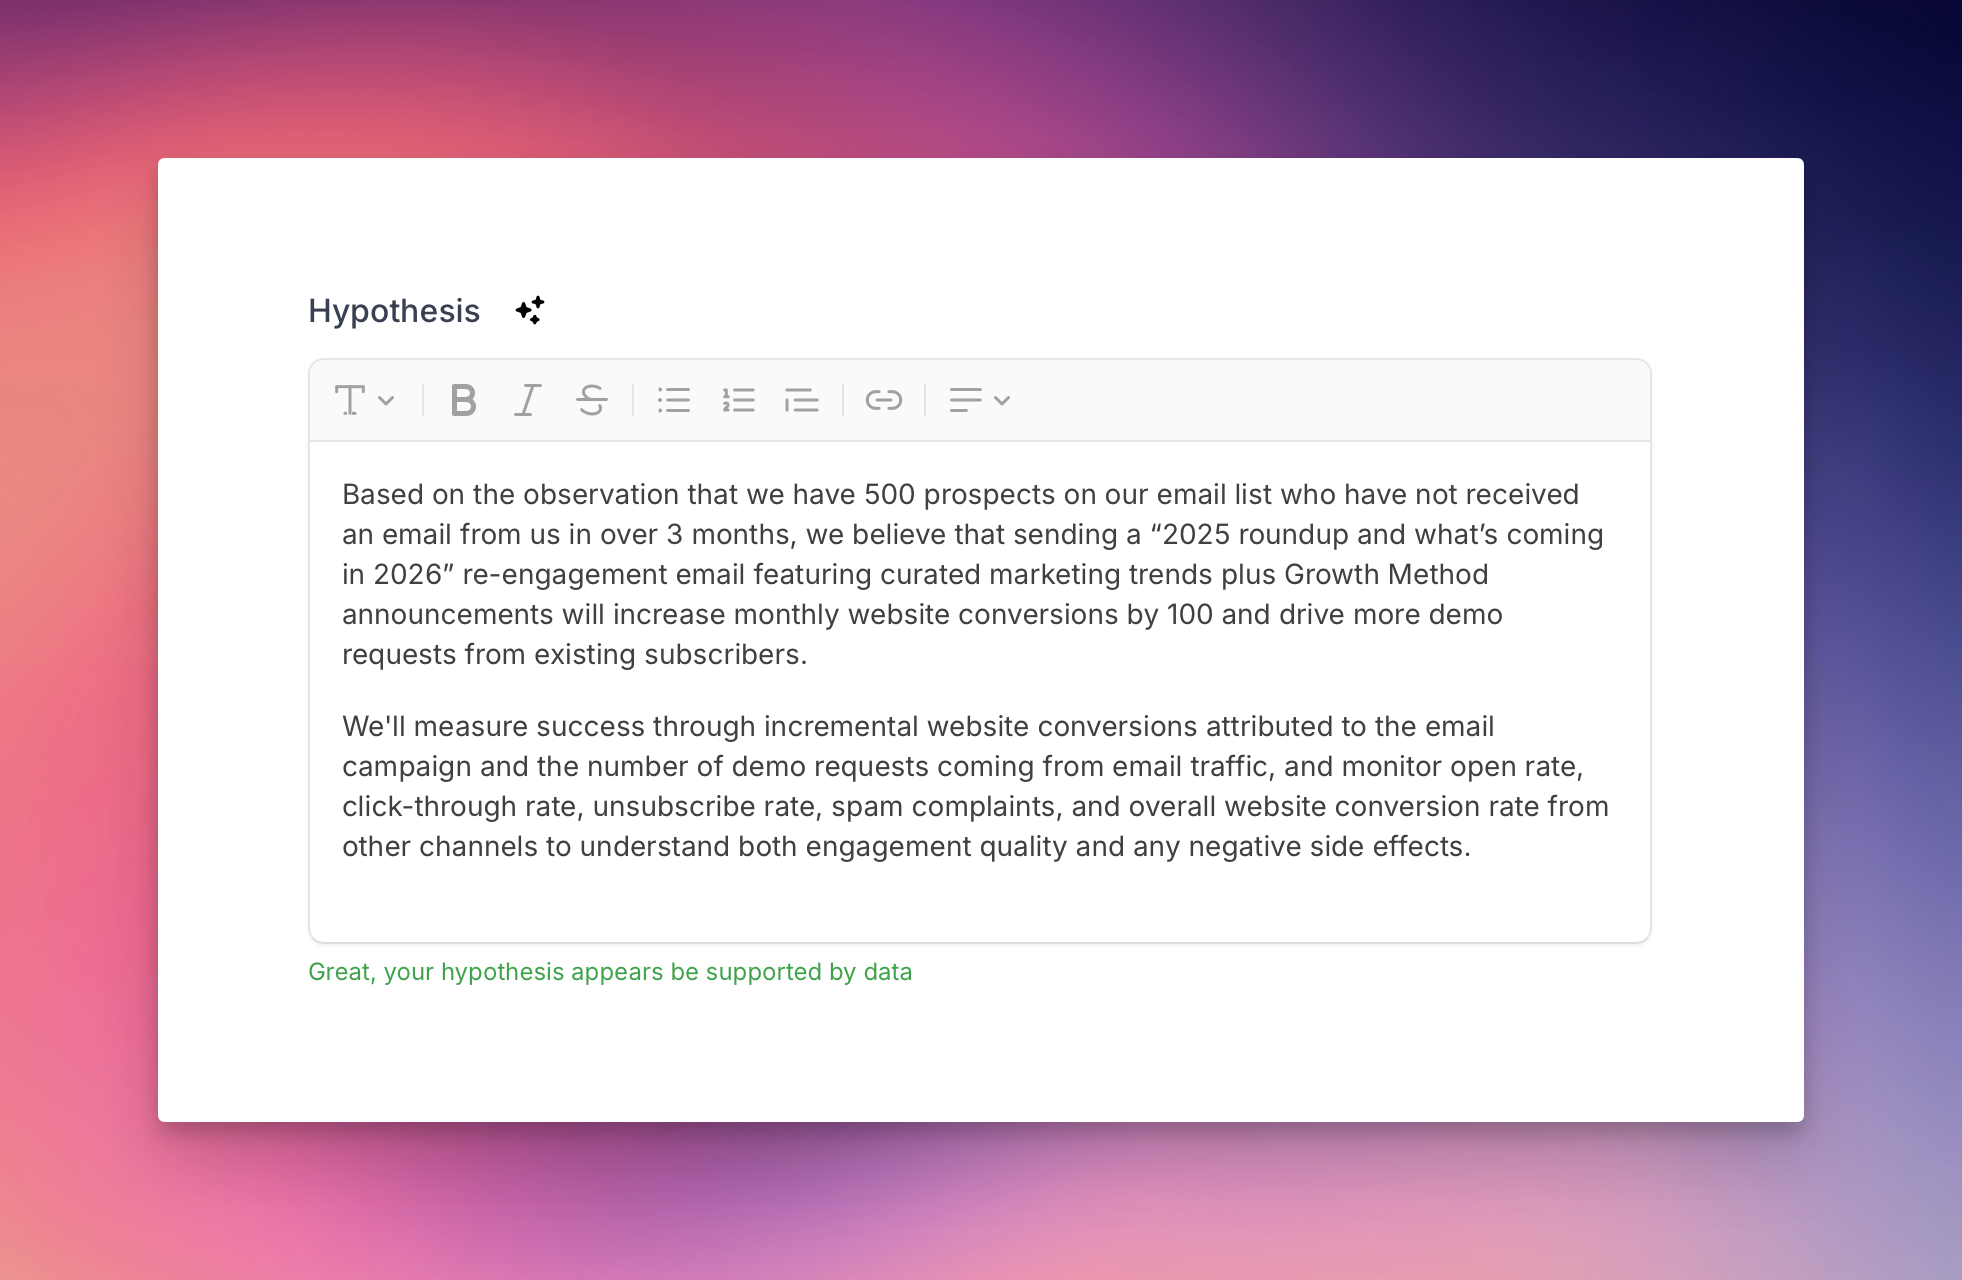
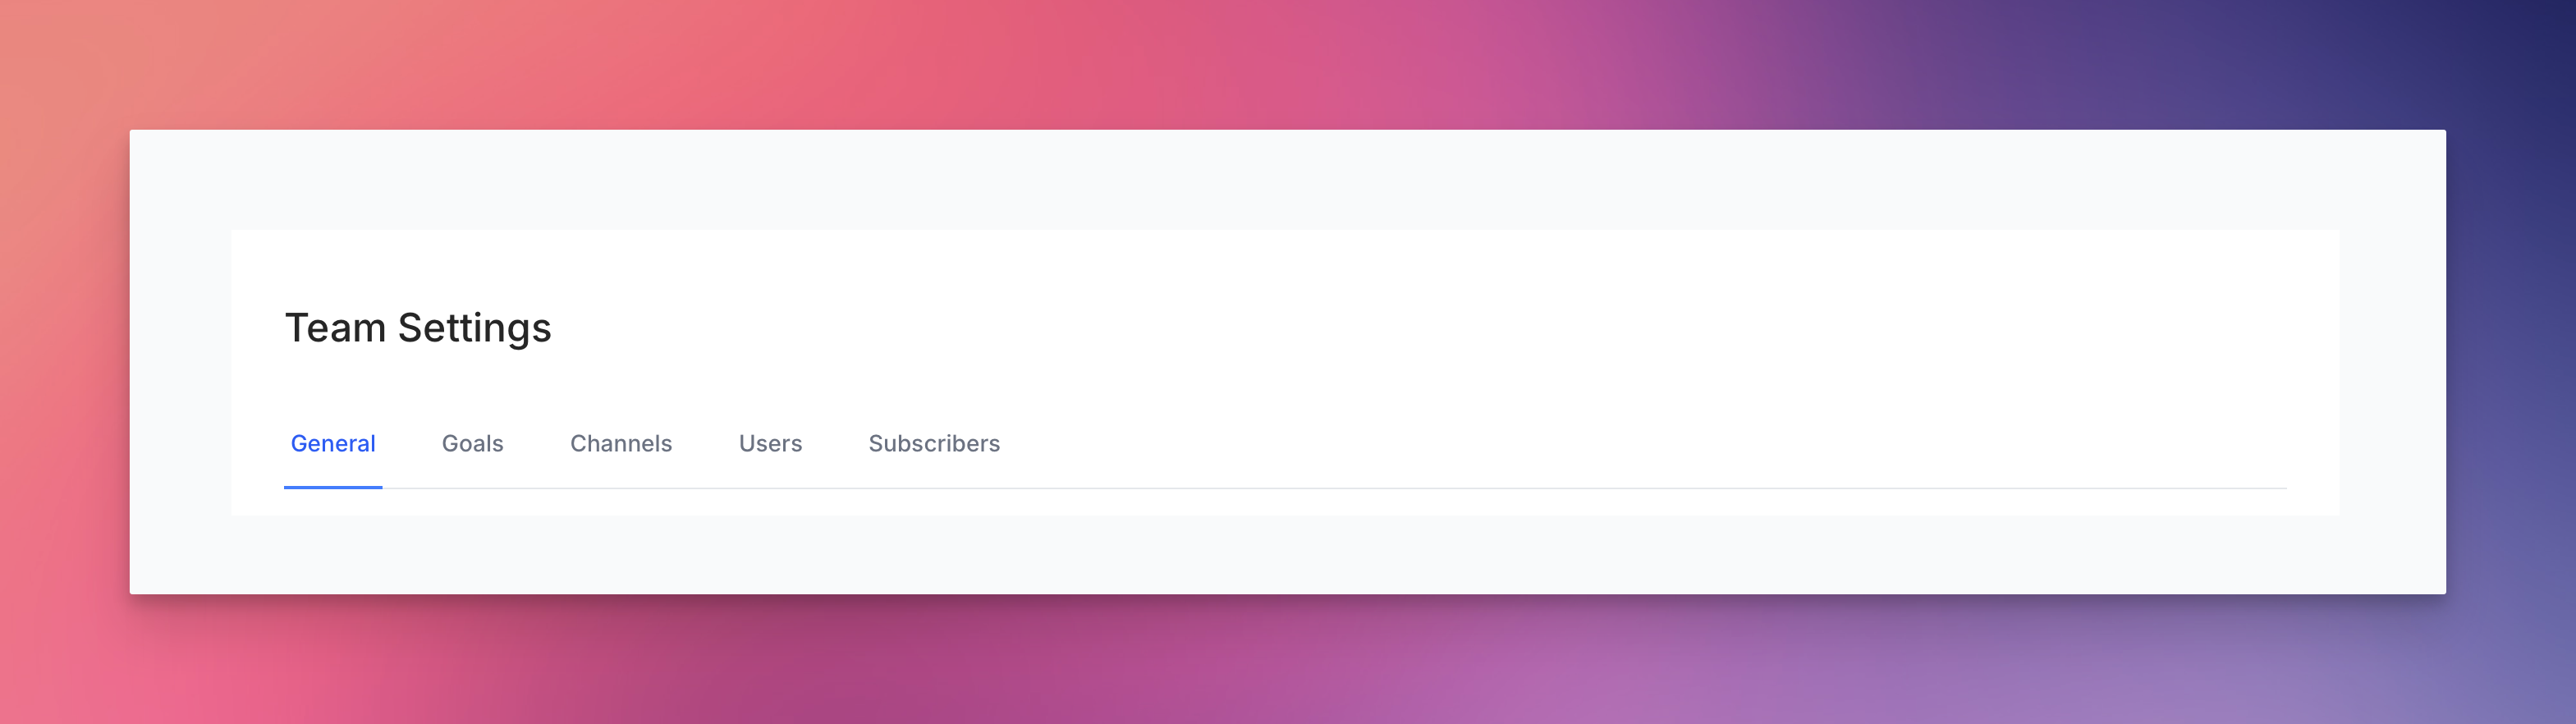
5th Jan 2026
Smoother navigation in team settingsFixed a layout issue that caused content to shift when navigating between different tabs in team settings.