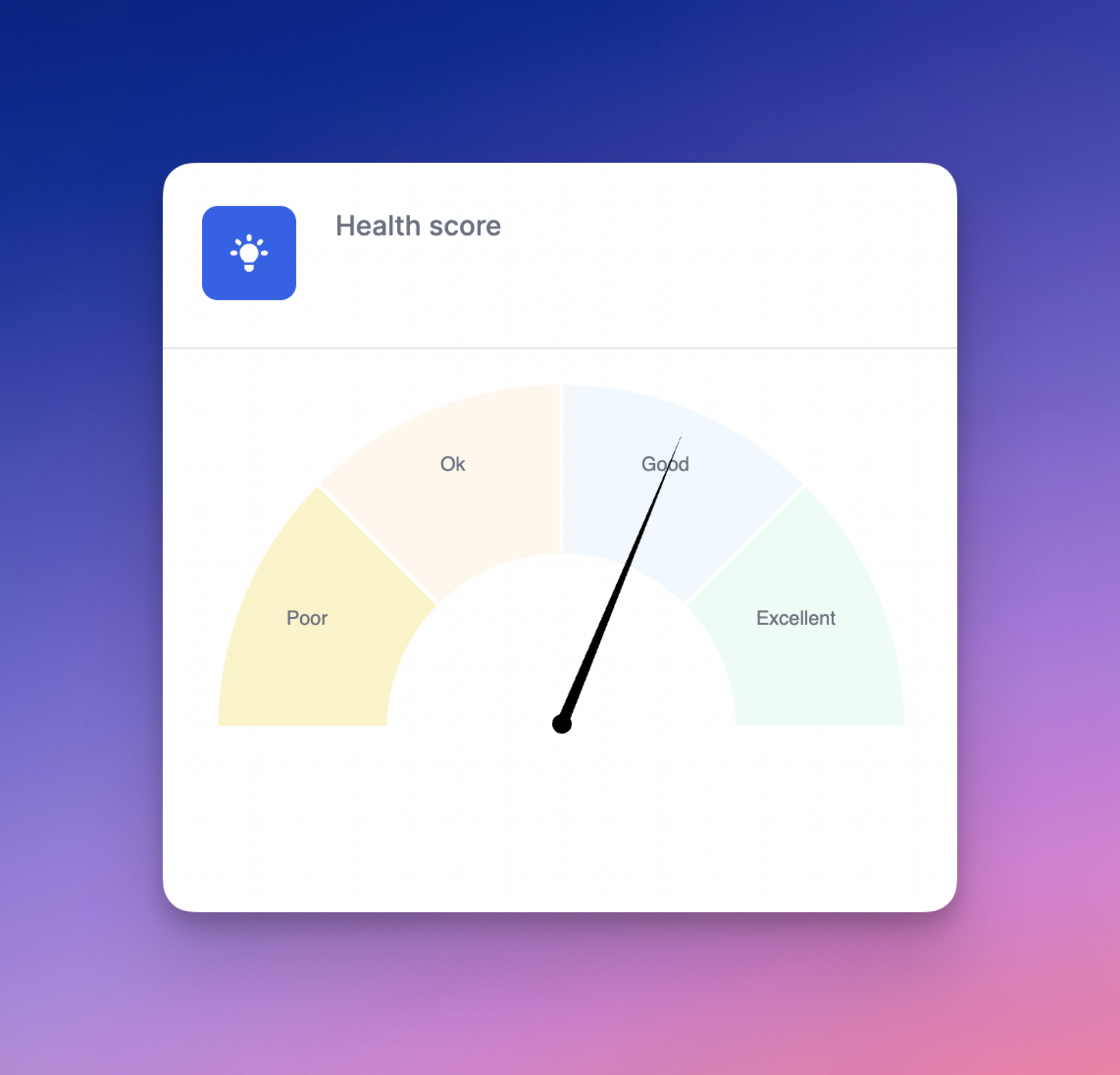
New health score.A new health score metric is now available on all customer dashboards.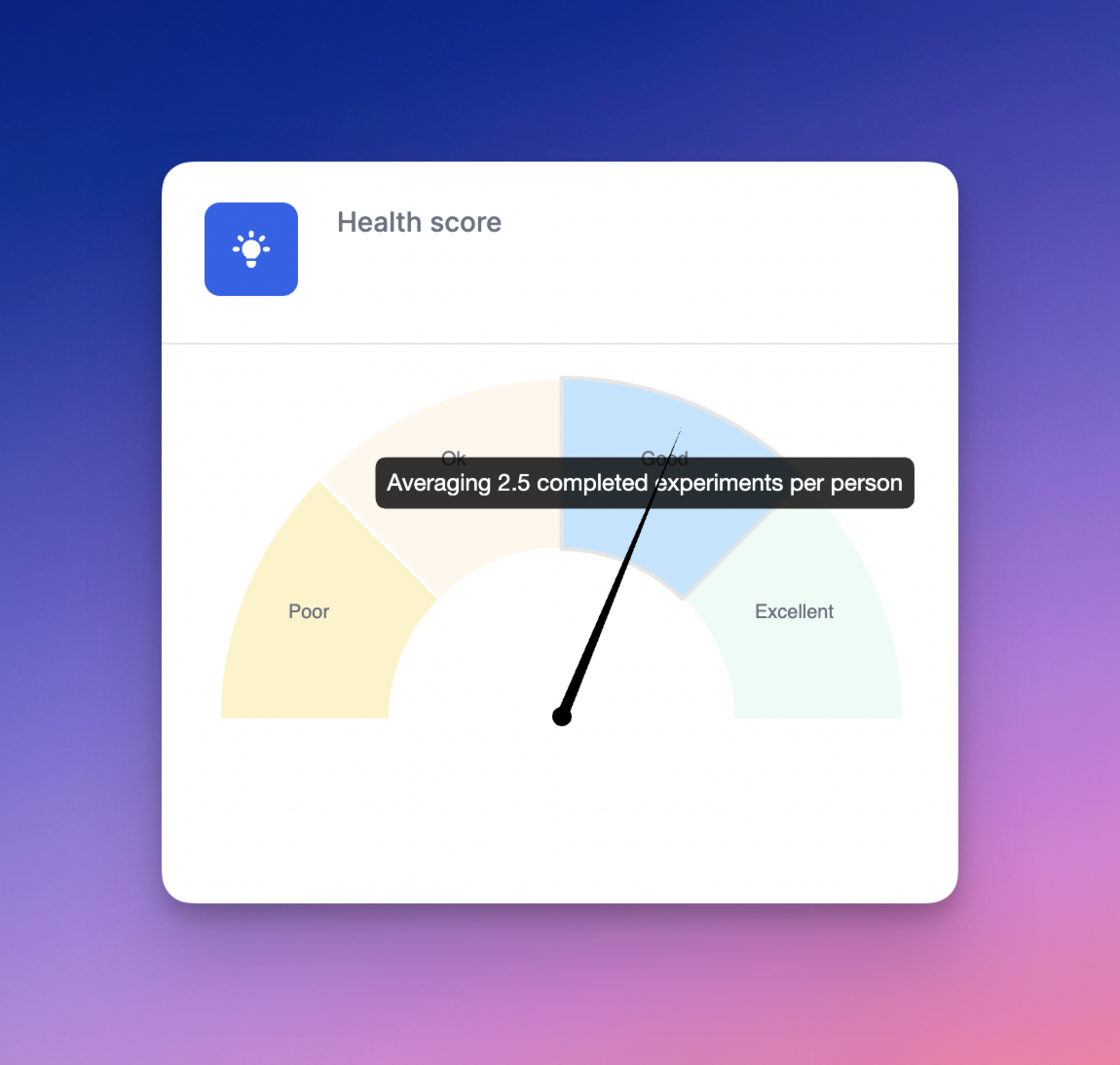
- less than 1/month = Poor
- 1-2 per month = Ok
- 2-3 per month = Good
-
3+ per month = Excellent
Additionally, hovering over the needle on the gauge graph shows the exact average of completed experiments for your team in the last 30 days.
Tooltips slowly rolling out.You will see new tooltips beginning to roll-out across the application, starting with the Hypothesis heading on ideas and experiments.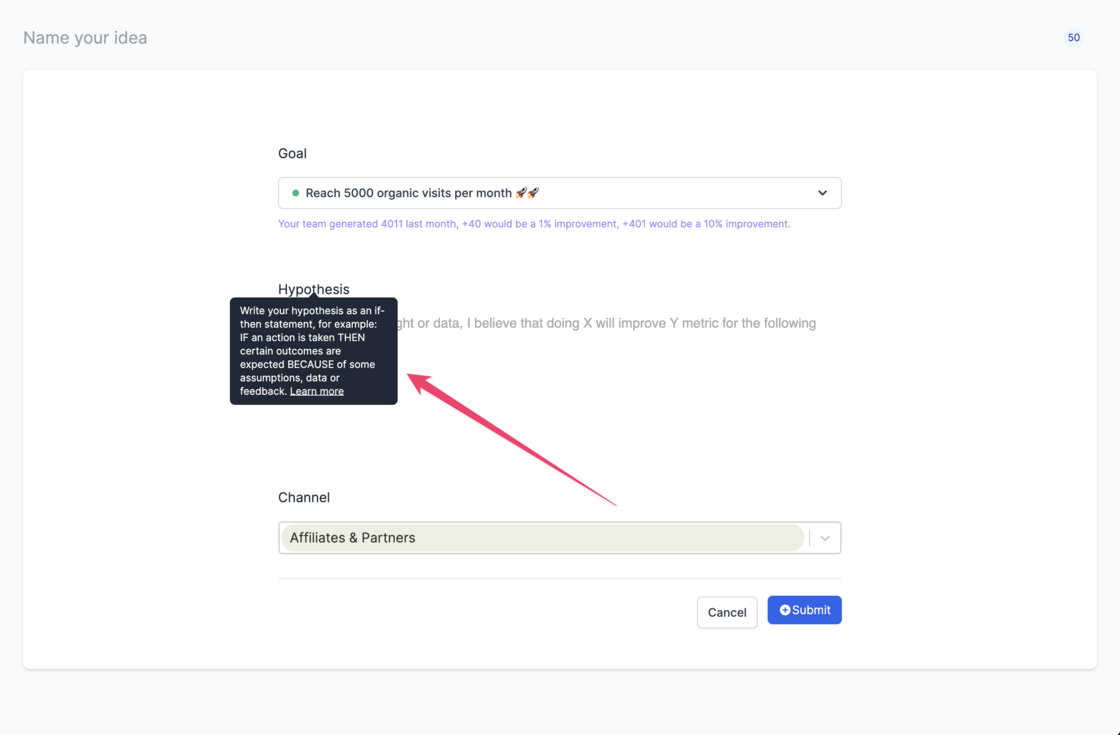
API integration details.We now provide additional details on
the integrations page
with the following details available for all data sources:
- The date and time of the last API request
- Details of the request made, including all request parameters (including startDate, endDate, metric and property)
- Whether the request succeeded or failed
Custom 404 page.For security reasons shared links automatically expire after 1 month. Once expired, instead of seeing a generic error page, visitors will now see a custom page enabling them to follow your team for future growth & experiment updates.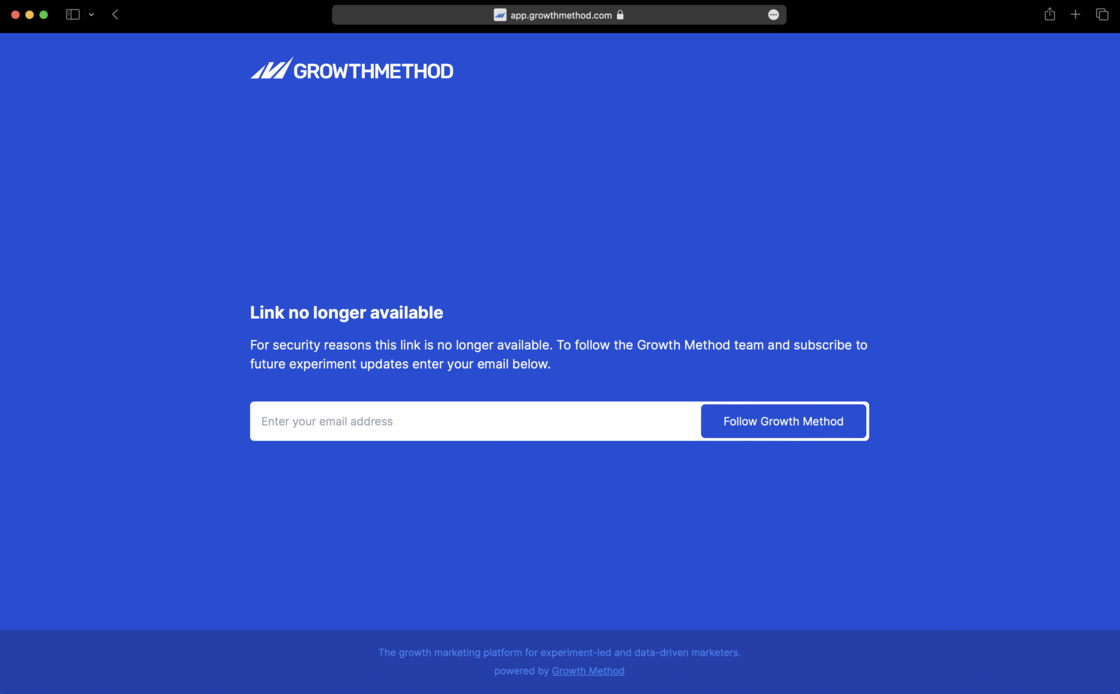
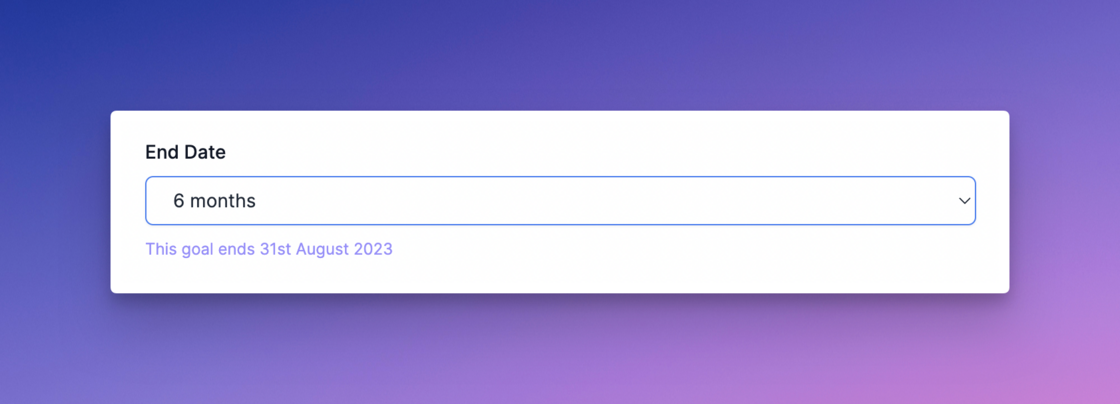
Goal timeframes.To simplify configuration and align with agile best practises growth goals can now be set with 4 timeframes, with 6 month goals being the default:
- 3 months
- 6 months (default)
- 9 months
-
12 months
Once selected we calculate and display the end date for you.
Scoring panel updates.We’ve made a couple of improvements to scoring mode as follows:
- Changes to the scoring panel are saved instantly
- The ‘Save’ button has been removed (one less click needed 🙏)
- We’ve added the ability to Like/Unlike an idea from the scoring mode panel In general this should make it easier and quicker for you and your team to prioritise your unscored ideas.
Fixed number indicator.Fixed a small bug where the number indicator showed an incorrect value after deleting ideas.
Email replies to notifications.We now set the ‘reply-to’ address for notifications so that if a subscriber replies to a notification, the reply is sent to the experiment owner by default.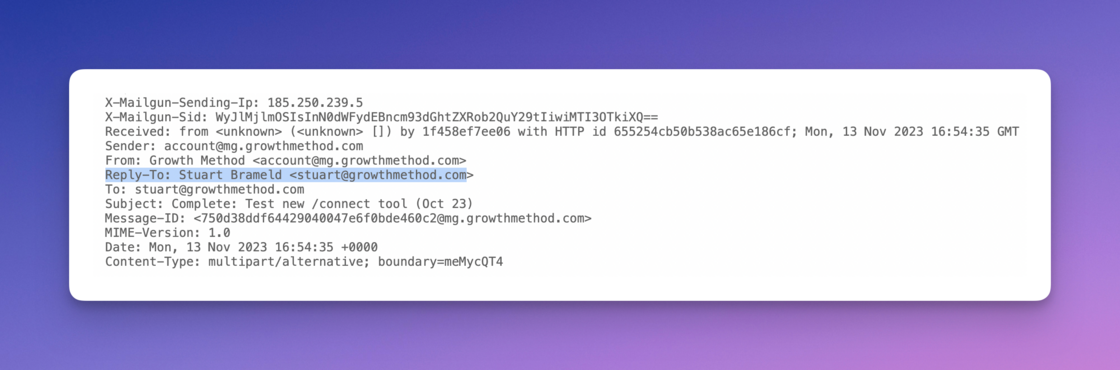
Build followers for your team 🚀.Growth Method now allows individuals to follow a teams growth experiment updates in an automated fashion without stakeholders ever needing to login to the app or become paying users.
Individuals can subscribe to your team using any standard Growth Method share link e.g.
https://app.growthmethod.com/gallery/growthhackers-experiments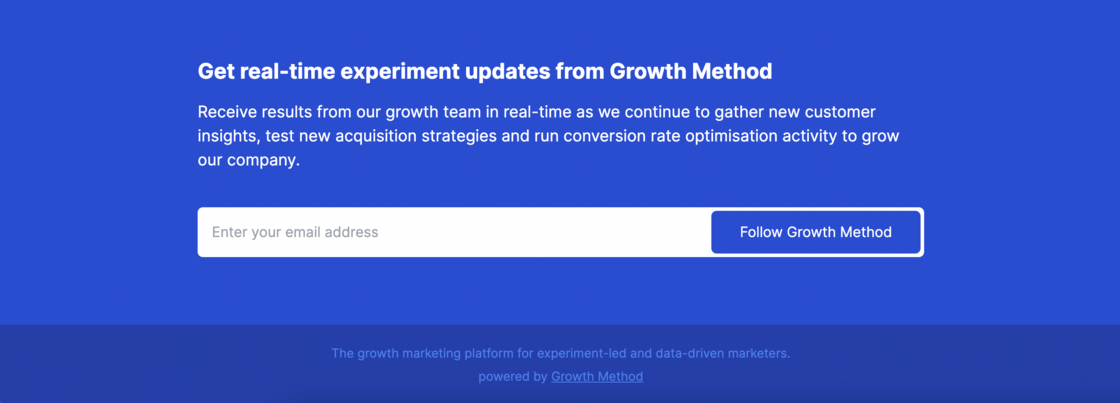

- Nobody can subscribe to your team (the default)
- Anyone with a *@yourcompany.com email address can subscribe
- Anyone can subscribe (no restrictions) You can also allow combinations of specific domains and individuals, for example: @yourcompany.com,@youragency.com,joe.bloggs@growthcontractor.com . Once signed-up, followers receive email notifications automatically when growth experiments are moved to in progress or complete.
Recording 0 in experiment results.Fixed a small bug where recording a change of 0 (i.e. no change) would not save correctly for some users.
API request details.You can now view details on the API calls to your integrations by clicking the small help icon next to your data source under Team Settings -> Integrations.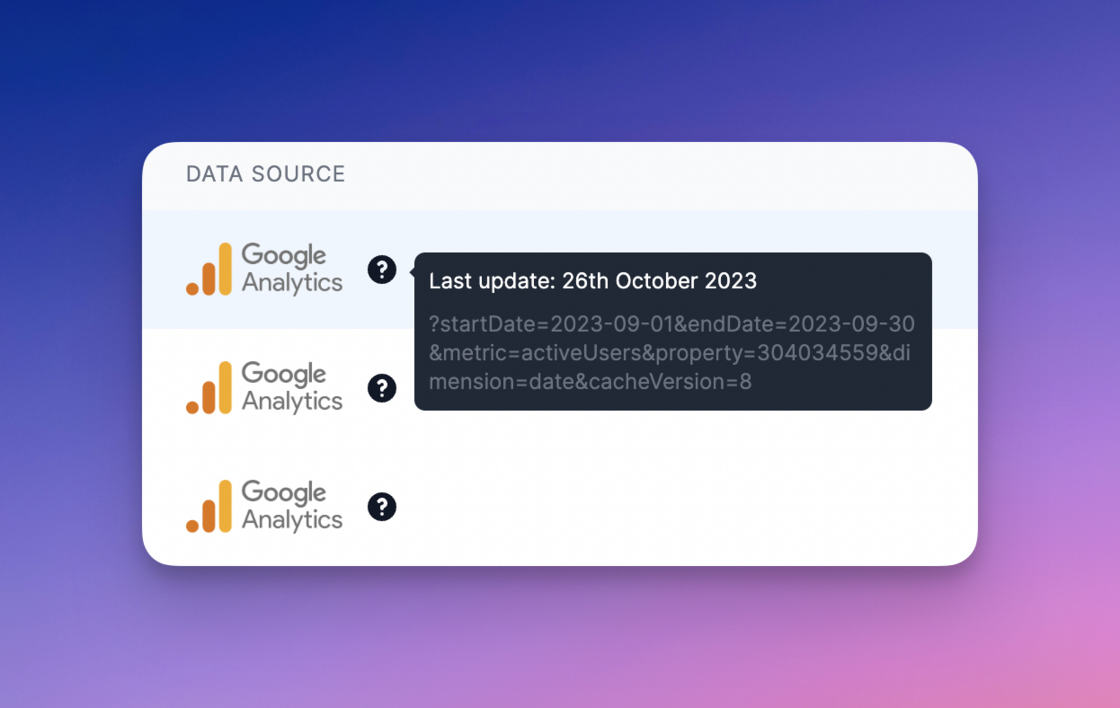
- The data of the last API request, in this case 26th October 2023
- The API query sent, including startDate, endDate, Google Analytics property ID and metric (in this case activeUsers) We have plans to add additional information over the coming weeks.
Graphing update.The Y/vertical axis on your homepage graph has been updated to better represent your specific data.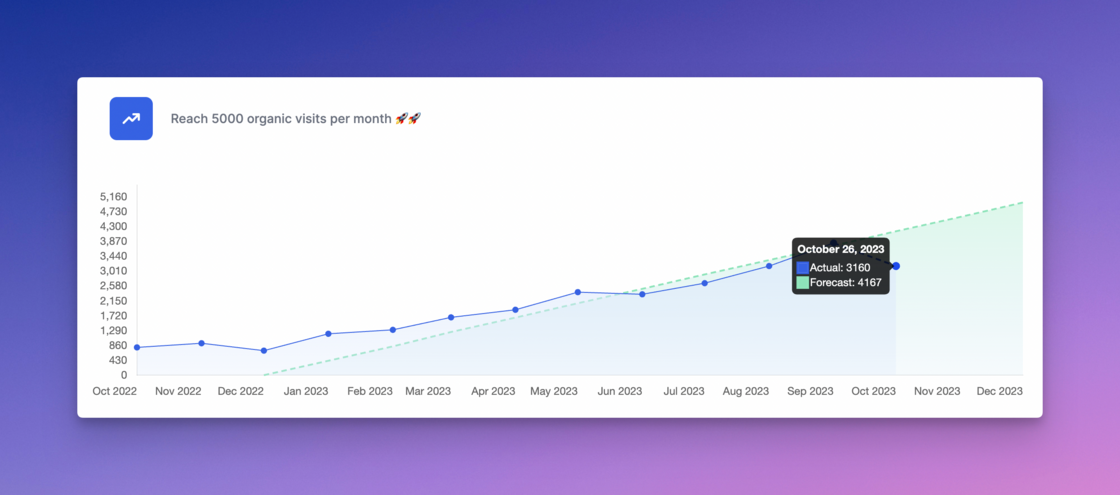
Menu change to ‘Integrations’.As part of planning for upcoming improvements the ‘Funnel’ tab under integrations has been relabelled ‘Integrations’.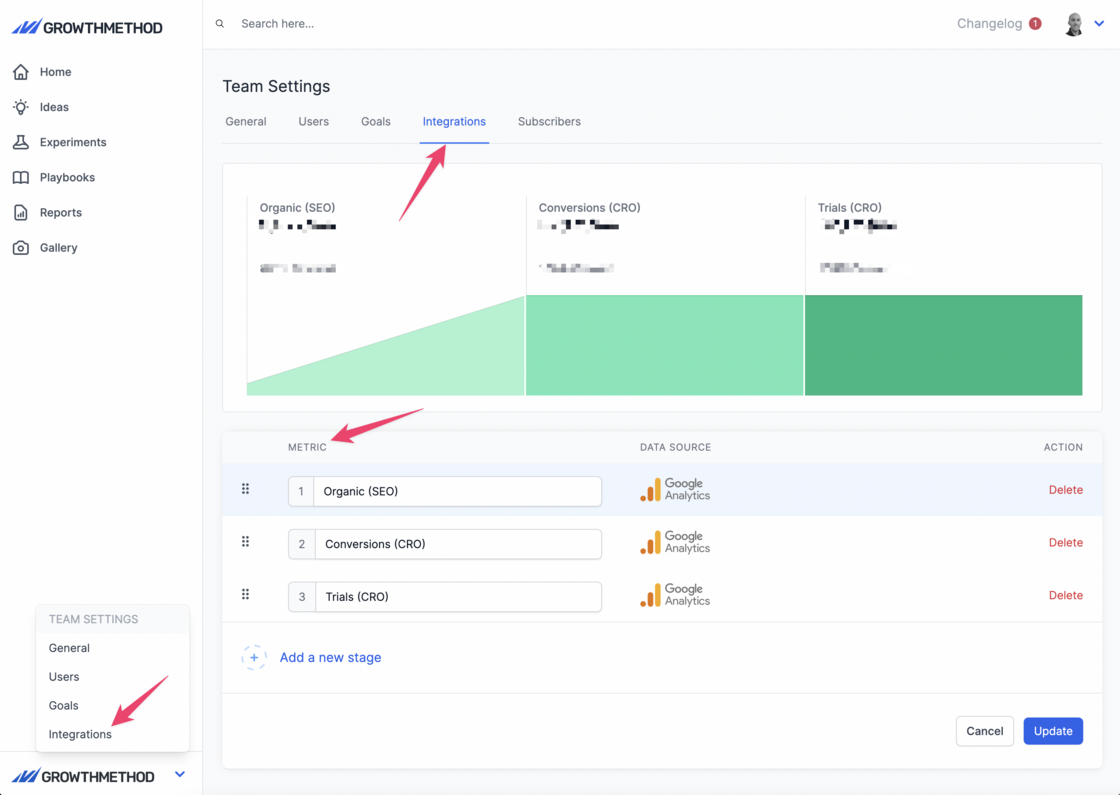
+3 months graph data.Homepage graphs now display the last 3 months of data before the goal start date providing useful historical context.
Supporting data.Supporting data is now displayed for all growth goals based on the relevant data integration.
Primary goal graph update.In order to support the change to per month (as opposed to cumulative) growth goals, and to provide more clarity for users, we now also display values by month on the X axis:

Confirm dialog update.We have swapped the options on the dialog box that is displayed upon completing an experiment.
The primary action is now ‘Refine this idea’ (which creates a new linked version) and the secondary action is to ‘Create new idea’ (which takes you to the new idea submission form).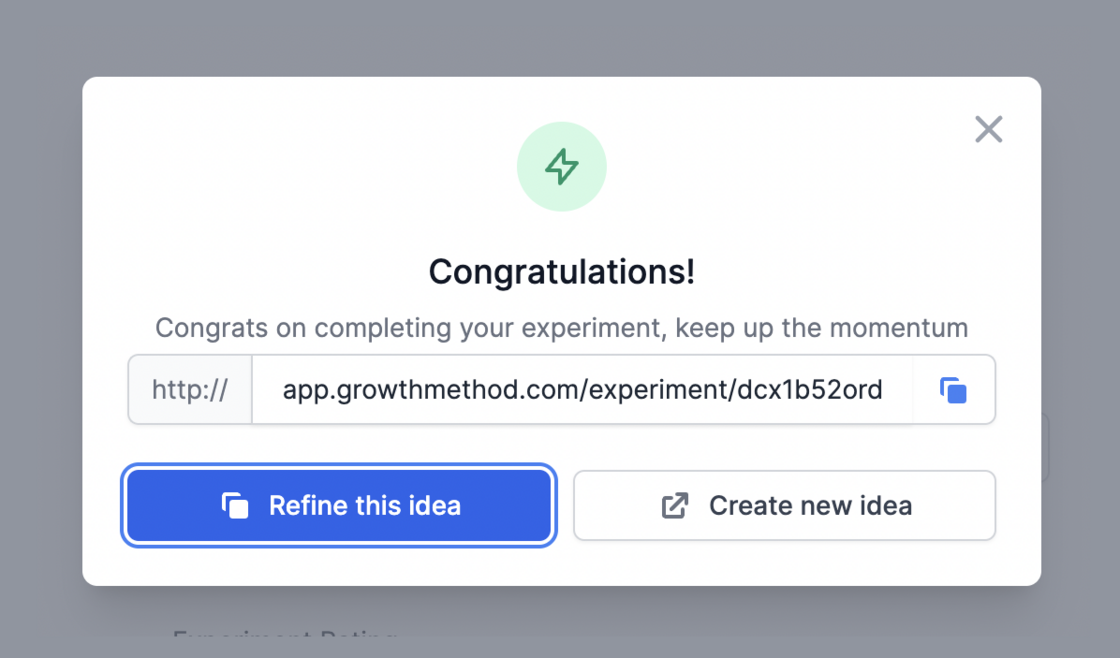
Warning on funnel stage delete.In order to prevent customers from making changes that could affect their experiment data and reports we prevent potentially destructive actions by default and suggest reaching out for support.
Contextual data when editing goals.When setting a goals target we now display contextual data to help inform your decision. We continue to recommend goal timelines of at least 6 months for most teams.
We continue to recommend goal timelines of at least 6 months for most teams.Customer billing portal.Under Team Settings -> General you will now find a link to your customer billing portal. The customer billing portal is a secure, Stripe-hosted page that lets you manage your billing information. You can:
The customer billing portal is a secure, Stripe-hosted page that lets you manage your billing information. You can:- Upgrade, downgrade, or cancel your subscription
- Update payment options
- View your billing history
Truncated titles for imported data.Idea and experiment titles for existing customers and users are limited to a maximum of 50 characters to maintain a high-quality UI & UX, particularly for reporting. Whilst the 50 character limit only applies to titles entered via the Growth Method app, we now auto-truncate idea and experiment titles from imported data as well. A 3-dot ellipsis is shown to indicate where titles have been shortened.
Whilst the 50 character limit only applies to titles entered via the Growth Method app, we now auto-truncate idea and experiment titles from imported data as well. A 3-dot ellipsis is shown to indicate where titles have been shortened.Duplicate results in search.Some customers may have noticed duplicate records in search results in recent weeks. This issue occurred as the result of a recent system upgrade and the issue is now resolved.
Real-time data integrations.Growth Method now supports real-time data integrations from a range of marketing platforms including Salesforce Marketing Cloud (ExactTarget), Salesforce Marketing Cloud Account Engagement (Pardot), HubSpot, GA4 and other API-enabled platforms.
This data is used throughout the app (in funnel charts, goals, ideas and experiments) to provide context to your teams growth activities. Using GA4 as a popular example, Growth Method can make a simple request for a single metric (such as activeUsers) as below:In addition Growth Method supports more advanced requests such as the query below where the customer wishes to filter for specific GA4 conversion events:Note: Real-time data requests are made every 24 hours for all funnel stages configured in your account. Whilst these data queries cannot be configured by customers at this time, we plan to enable this soon.
Using GA4 as a popular example, Growth Method can make a simple request for a single metric (such as activeUsers) as below:Add links to data sources.Custom links can now be added to all funnel stage data sources. This can be useful should you wish to link to a specific data source report or dashboard to easily verify that the source data matches with what you are seeing in Growth Method. All new customer accounts will include this by default as part of the onboarding process. Existing customers should email
support@growthmethod.com
with the required links and we’ll get these added for you.
All new customer accounts will include this by default as part of the onboarding process. Existing customers should email
support@growthmethod.com
with the required links and we’ll get these added for you.
All new customer accounts will include this by default as part of the onboarding process. Existing customers should email
support@growthmethod.com
with the required links and we’ll get these added for you.Improvements to results.When moving an experiment to the analysing stage you will be prompted to enter results for the funnel stage linked to your current growth goal. The ‘Record additional metrics’ link displays any additional funnel stages you have configured and enables you to capture experiment metrics related to these funnel stages as well.
 Once data has been added for all stages in your marketing funnel, the ‘Record additional metrics’ prompt is no longer visible.
The ‘Record additional metrics’ link displays any additional funnel stages you have configured and enables you to capture experiment metrics related to these funnel stages as well.Once data has been added for all stages in your marketing funnel, the ‘Record additional metrics’ prompt is no longer visible.Goal forecast v actual.On loading the Home screen we now always display your goal Forecast and Actual for the current month, by default.
Funnel data on experiments.We now display your recent funnel stage data when viewing Experiments, as well as Ideas. This data is retrieved automatically from Google Analytics, HubSpot, Salesforce or a number of other integrations and provides further context to your growth work.
This data is retrieved automatically from Google Analytics, HubSpot, Salesforce or a number of other integrations and provides further context to your growth work.Improved hypothesis validation error.We’ve updated the hypothesis error text that is displayed when a hypothesis includes no quantitative data to make it clearer what users need to do.
“Your hypothesis appears to have no quantitative data to support it (please add some numbers!)”
View new idea after submission.For new users, it could appear as though new ideas vanish upon submission (they are safely in Unscored ideas, but our default is to take you back to Scored ideas).
We now redirect you to Unscored Ideas immediately after submission, ordered by most recent first, so that your new growth idea will be visible immediately, right at the top of the list.
Update to weekly progress report.A link to your liked ideas is now included in your weekly progress report.
“For new experiment ideas, review your liked ideas.”
Self serve trial accounts.It is now possible to signup for your own trial account at
https://app.growthmethod.com/signup.


- Enter your email & accept our terms of use and privacy statements.
- Enter your name, company and set a password.
- Check your email and activate your account
- Your account will be created with a trial marketing funnel along with a few ideas and experiments to get you started.
Shared links update.Shared links allow you to keep internal stakeholders and 3rd parties up to date, without them needing access to your Growth Method account. We have now made a number of improvements to the shared link functionality as below:
We have now made a number of improvements to the shared link functionality as below:- When choosing to share an idea, experiment or playbook, the most recent share link is displayed automatically.
- If a sharing link doesn’t exist, or if it has expired, a new one will be generated automatically and displayed for you to use.
- Regenerating a share link creates a completely new link which does not affect any previous link. Shared links continue expire after 6 weeks for security reasons.
Liked idea detail.If an idea is liked by more than one person, this is now indicated next to the icon. Additionally, hovering over the icon provides details of the individuals that have liked an idea.
Update to individual report.Liked ideas are now included in individual overview reports as an additional prompt and reminder for future experiments. Note: this section will not show unless you have one or more liked ideas
Note: this section will not show unless you have one or more liked ideasFiltering ideas by category.A new filter on the ideas table means you can now quickly and easily filter for all ideas related to a specific channel (or topic).
Team goals UI improvements.We’ve made a few improvements to the Goals screen under Team settings, including adding traffic light indicators to active (green), planned (orange) and archived (red) goals.
Experiment action menu.A new action menu has been added to the experiment view in order to provide additional options when viewing an individual experiment, currently these are:
- Share - to create a sharing link
- New version - to create a new linked version of the experiment
- Delete - to delete the experiment Additional functionality will be added to this menu over time.
Experiment versioning fix.Versioning now display consistently across all related experiment versions allowing you to see a complete history of your experiment iterations.

New title length limit.Idea and experiment titles are now limited to 50 characters in order to prevent long titles being cut-off or continuing to a new line.
This allows us to continue to improve the quality and consistency of Growth Method reports.
A new character count indicator updates as you type to show the number of characters remaining.
Integrations setup for trial users.A new banner under the Funnels tab now displays in all trial accounts and provides a meeting scheduling link for customers to setup analytics integrations.
Notification on ‘In Progress’.We have added a modal alert that displays when moving an experiment to In Progress, as below. As a reminder, emails are now sent when:
As a reminder, emails are now sent when:- An idea is submitted
- An experiment is started
- An experiment is moved to In Progress All users also receive their personal status report every Friday.
Traffic light indicators on goals.The UX around goals has been improved with coloured “traffic light” indicators or the goal select drop-down. These are as follows:
- Active = Green
- Planned = Orange
-
Archived = Red
Growth Method will always default to using your active goal where possible.

Various UI & UX styling updates.We have made a number of small fixes and improvements to the UI and UX throughout the app, including:
- Fixed column sizing in Manager and Team reports
- Updated playbook heading fonts
- Improved styling of goal and forecast graphs
- Improved highlighting of funnel stage with active goal
- Improved hypothesis placeholder text
- Improved styling of overdue experiments
- Improved styling of ICE scoring panel
- Improved results calculation styling
Integrate your marketing funnel data.We are now able to integrate with your entire marketing stack, including Google Analytics, HubSpot, Salesforce, and any other marketing solution with a public API. This allows us to display contextual data throughout the app and accurately measure the impact of individual experiments on your funnel goals.
This allows us to display contextual data throughout the app and accurately measure the impact of individual experiments on your funnel goals.Display funnel data for new ideas.Leveraging our integration capabilities we can now show data related to the area of your marketing funnel you are aiming to grow.
Working on increasing MQLs? We’ll show your MQL funnel data below the goal for additional context.
Fixed line graph bug.Fixed a small bug with cumulative idea and experiment line graphs that occurred for some users when the time period crossed the calendar year. These now display correctly.
These now display correctly.Growth goal and forecast.We have just shipped the first release in a major update to growth goals and projections.
 The forecast is currently a simple linear projection. We will be adding more advanced projections in the future that take into account both seasonality, historic data and compound growth.
- Connect your marketing data to Growth Method (Google Analytics, HubSpot, Salesforce etc)
- Map your current funnel stages (for example Visitor -> Lead -> MQL -> SQL -> Customer)
- Pick a stage of your marketing funnel to improve, such as Visitors
- Enter your growth goal for example - “Reach 1000 organic visitors by April” Growth Method will forecast the metrics needed to hit your goal on the specified date based on the most recent months data.
The forecast is currently a simple linear projection. We will be adding more advanced projections in the future that take into account both seasonality, historic data and compound growth.Reset an experiment.Experiments can now be ‘Reset’ using the action menu available in any of the experiment tabs. This is in addition to delete. Reset
moves an experiment back to an unscored idea.
Delete
removes an experiment and idea entirely.
Reset
moves an experiment back to an unscored idea.
Delete
removes an experiment and idea entirely.
Reset
moves an experiment back to an unscored idea.
Delete
removes an experiment and idea entirely.