Individual reports update.Individual reports
have been improved and now include the following for the time period: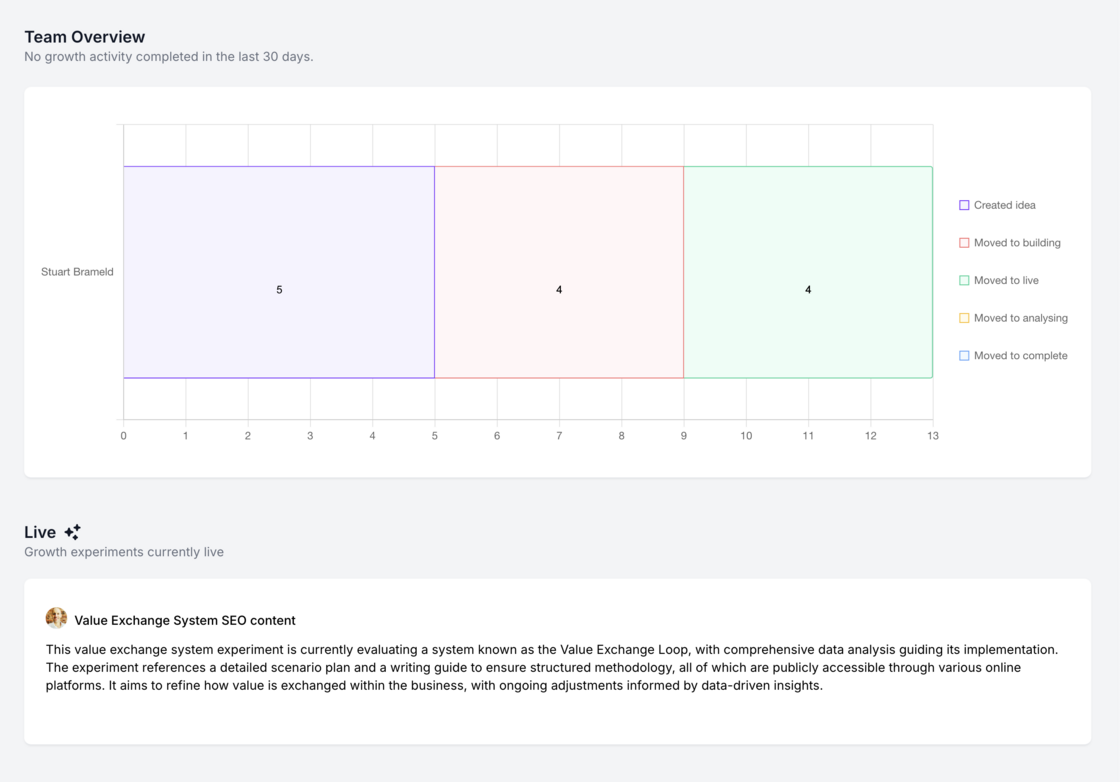

- Individual active & recently completed experiments
- Individual activity overview
- Individual liked ideas
Reporting on mobile.We have made a number of improvements to how weekly growth team updates are rendered on mobile.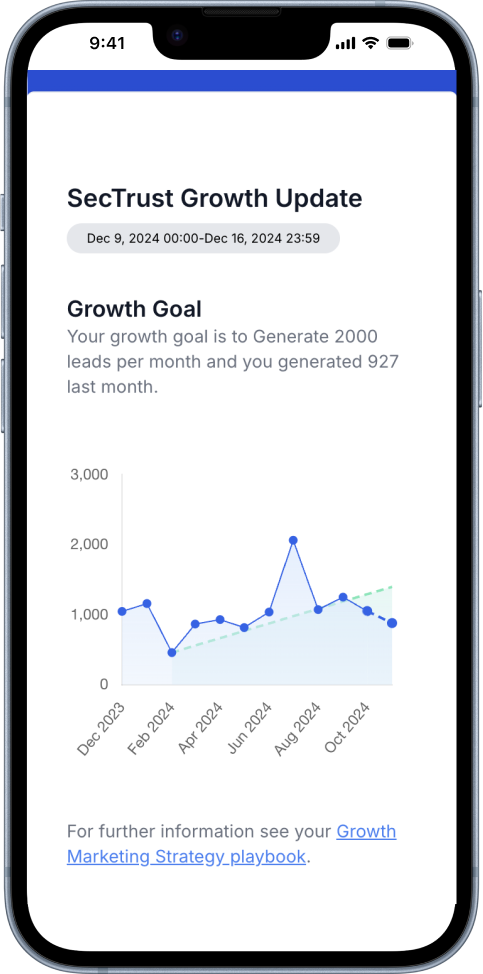
- Improved growth goal graph
- Improved team activity graph
- Better formatting of live and completed experiments
- Better formatting of top scored ideas
Individual report update.We’ve made a number of improvements to the individual (user-level) report.
- Team growth goal
- Team strategy document
- Individual live & recently completed experiments
- Individual growth activity
- Individual liked ideas Check it out here https://app.growthmethod.com/reports
Leaderboard report.You can now toggle between All time, Last 30 days and Last 90 days on the Experiments Leaderboard report.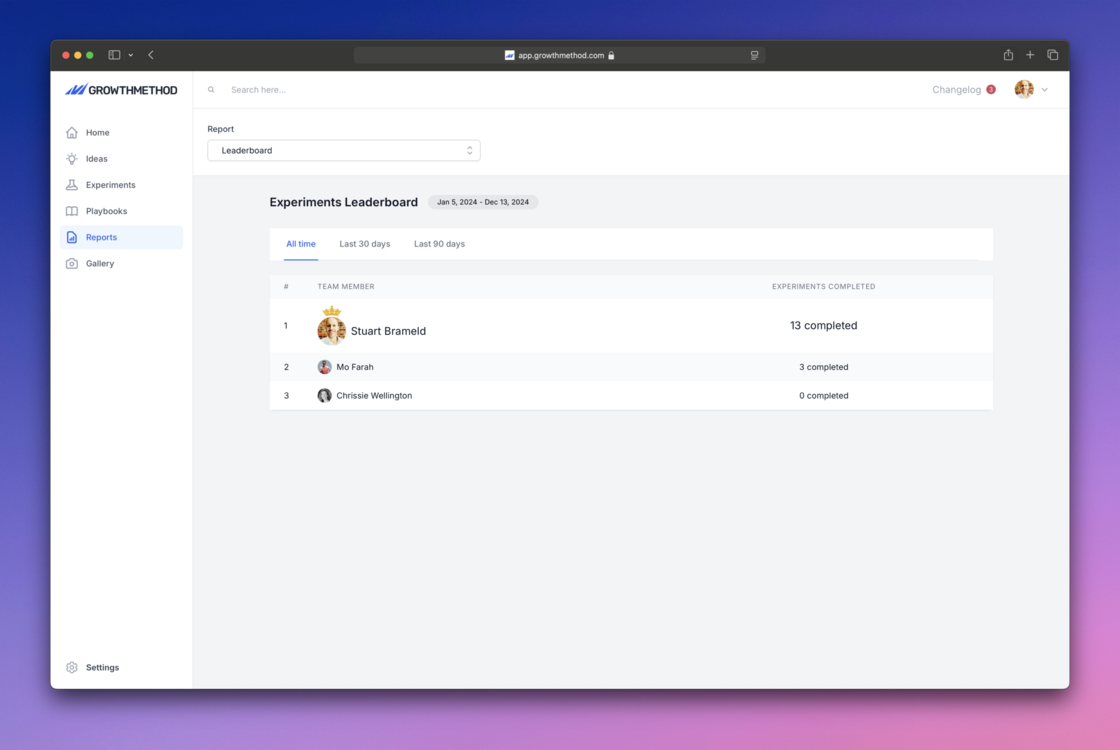
Updated growth activity graph.The growth activity graph, part of weekly team reports, has been updated to include ideas created in the time period.
- Created idea
- Moved to building
- Moved to live
- Moved to analysing
- Moved to complete
Team report updates.A number of improvements have been made to weekly team reporting as follows:
1 Set your reporting day
You can now set your report day in
Team Settings
.
Added channel in Top Scored Ideas.Channel categories have been added as a new column to the Top Scored Ideas section in the team growth report.
Experiment progress bar.We have made it easier to visualise where you are at in the lifecycle of an experiment with a new visual progress bar.
- Build - 1 week
- Live - 4 weeks
- Analysing - 1 week By default experiments should reach their completion date within 6 weeks of starting (i.e. a 6 week sprint).
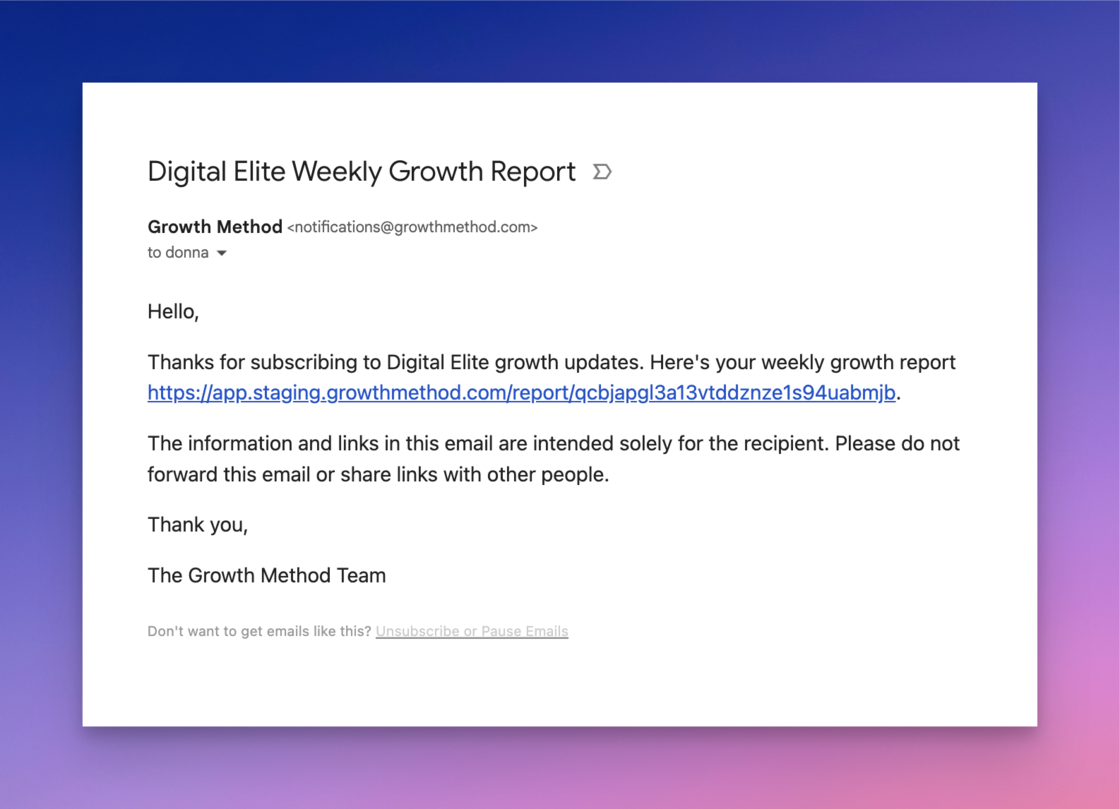
New email sending provider.All email is now being sent via our new sending provider
Bento
, this includes the following notifications and reports:
- Idea Submitted
- Experiment Started
- Experiment Completed
- New Subscriber Added
- Weekly Growth Report
- Individual Progress Report All emails now come from notifications@growthmethod.com (previously account@mg.growthmethod.com). We are fully DMARC, SPF and DKIM compliant. We will be making a number of enhancements to the Weekly Growth Report and Individual Progress Reports over the coming weeks.
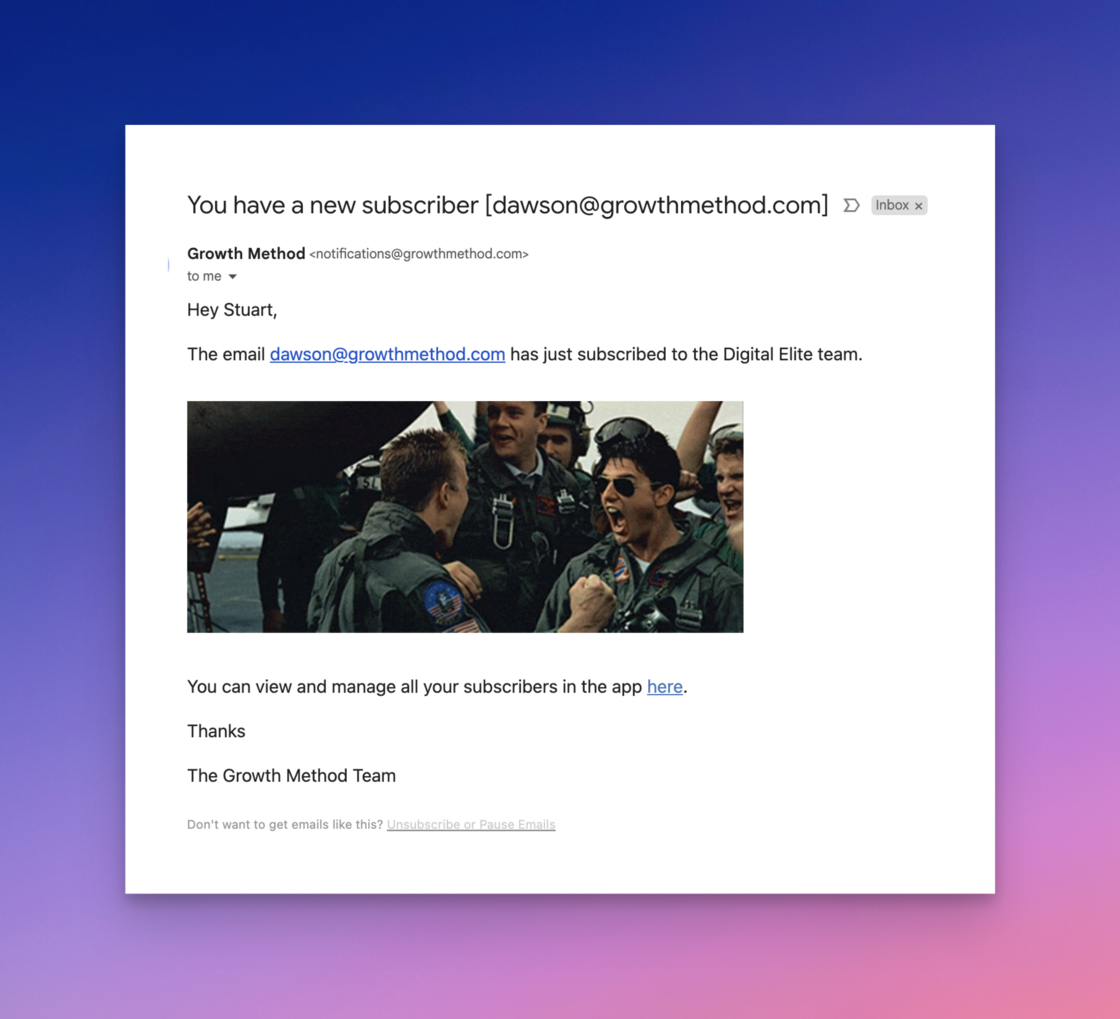
Update to subscriber notifications.All users in your team are now notified whenever a new subscriber is added, regardless of how they are added (by subscribing themselves via a shared link or by a team member adding them
in your team settings
).
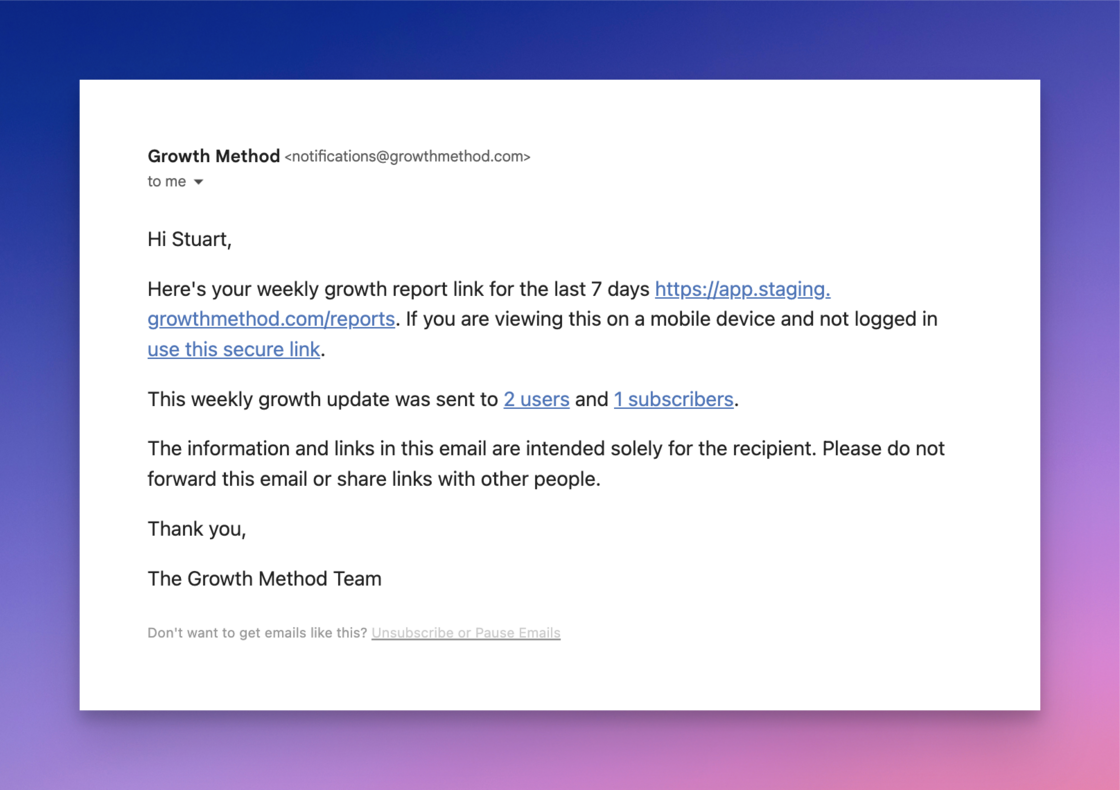
User & subscriber numbers in reports.Your user and subscriber numbers are now included in the footer of weekly growth report.
For example:
“View recent updates to your growth platform at
https://headwayapp.co/growthmethod-changelog.
This growth report was sent to 8 users and 25 subscribers.”
A reminder that all subscribers are
completely free
and you can add as many as you like.
Leaderboard report.A new ‘Leaderboard’ report has been added to the reports dropdown showing experiments completed in the given time period.
Title length restriction.In order to keep the weekly growth reports looking sharp and to avoid line wrapping of long titles we’ve implemented a 50 character limit on idea and experiment titles.
Action menu consistency.We’ve made a small ‘quality of life’ improvement and cleanup the experiment action menu to ensure it is consistent, regardless of where you access it from.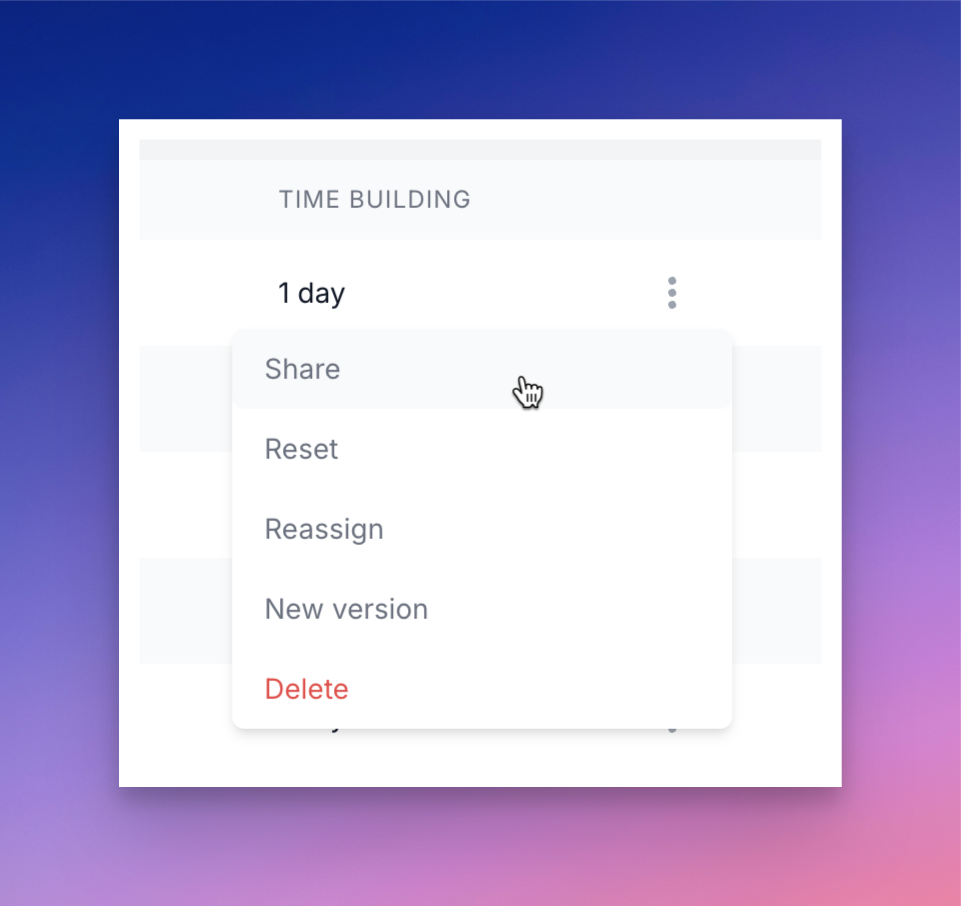
- Share - to generate a secure public sharing link
- Reset - to set the experiment back to the idea stage
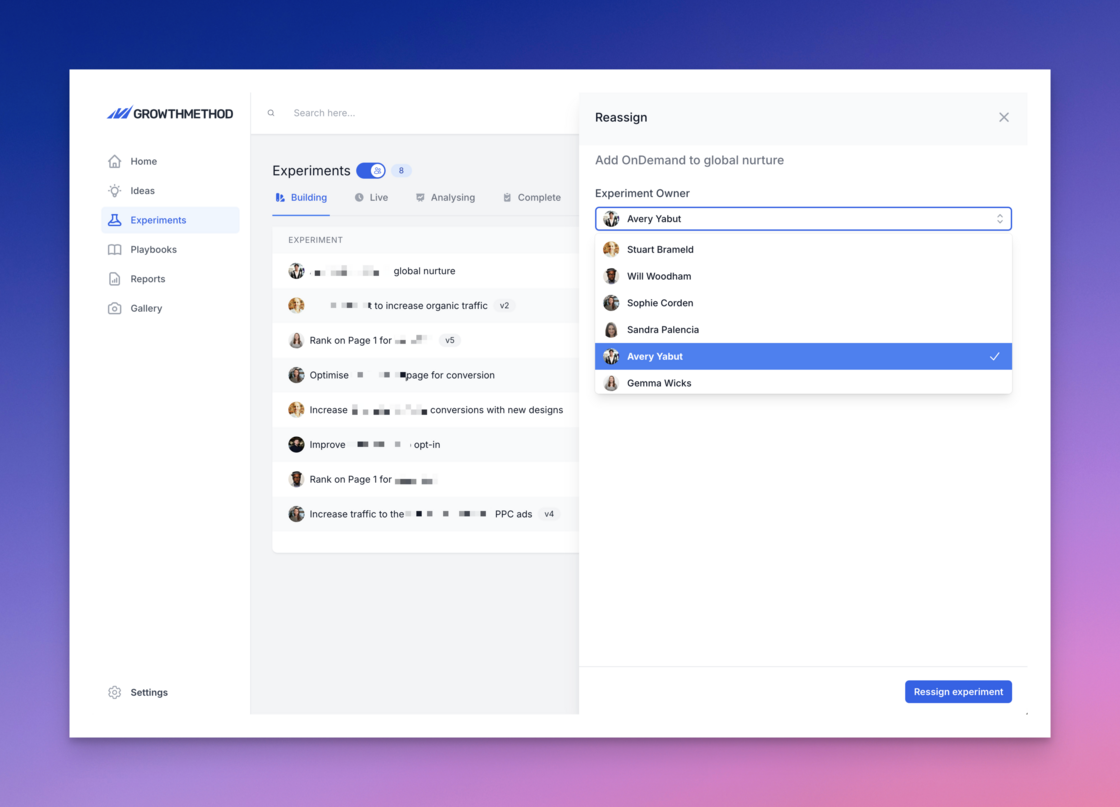
- Reassign - to reassign to another team member
- New version - to create a new version of the experiment
- Delete - to delete the experiment
Headshot tooltips on hover.Hovering on a headshot anywhere in the app now displays the persons full name - this includes experiment overview screens and in reports.
Growth report time periods.We’ve added ‘Last 7 days’ and ‘Last 30 days’ as options to the report time period dropdown and defaulted this to ‘Last 7 days’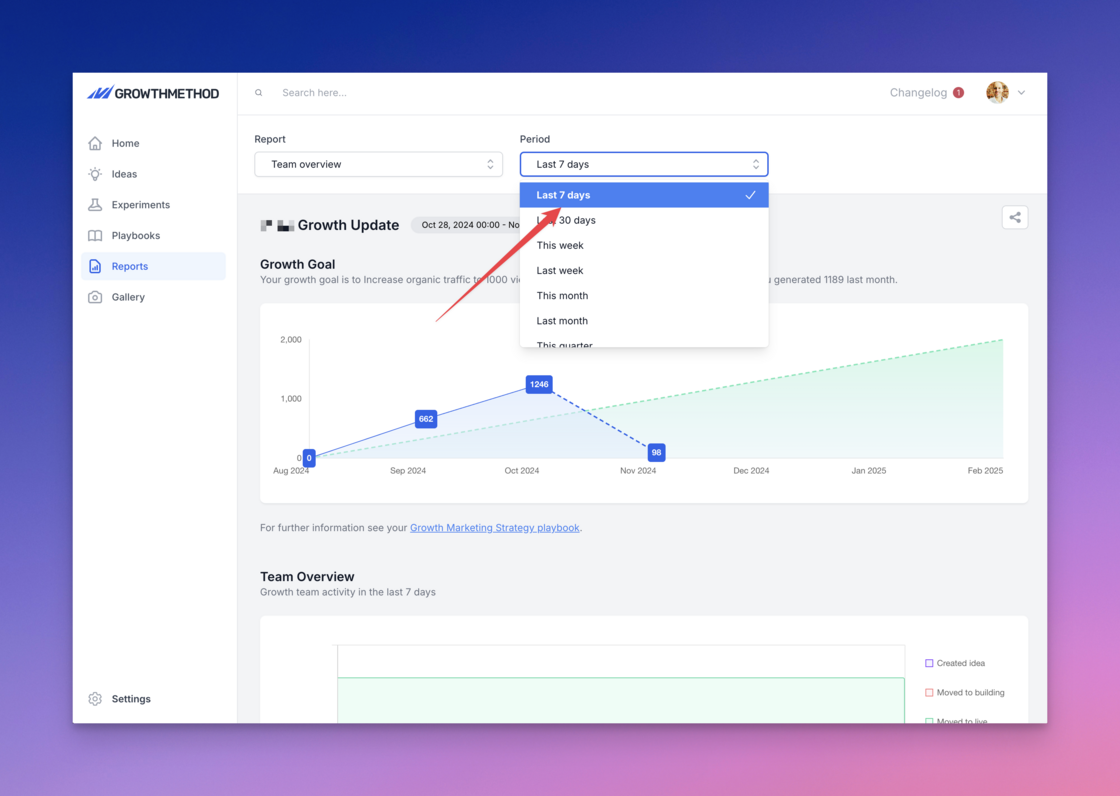
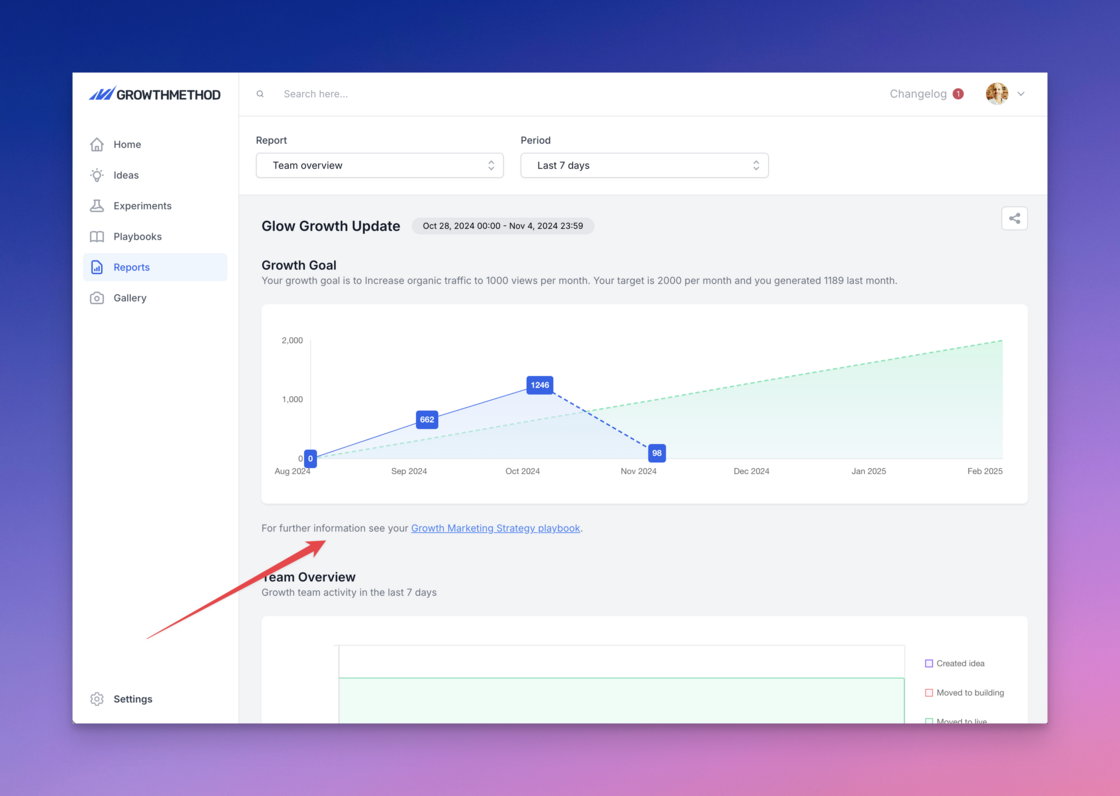
Growth strategy in weekly report.We recently made a change to ‘pin’ your growth strategy playbook to the top of your playbooks area for all customer accounts.
In addition to your growth strategy playbook being pinee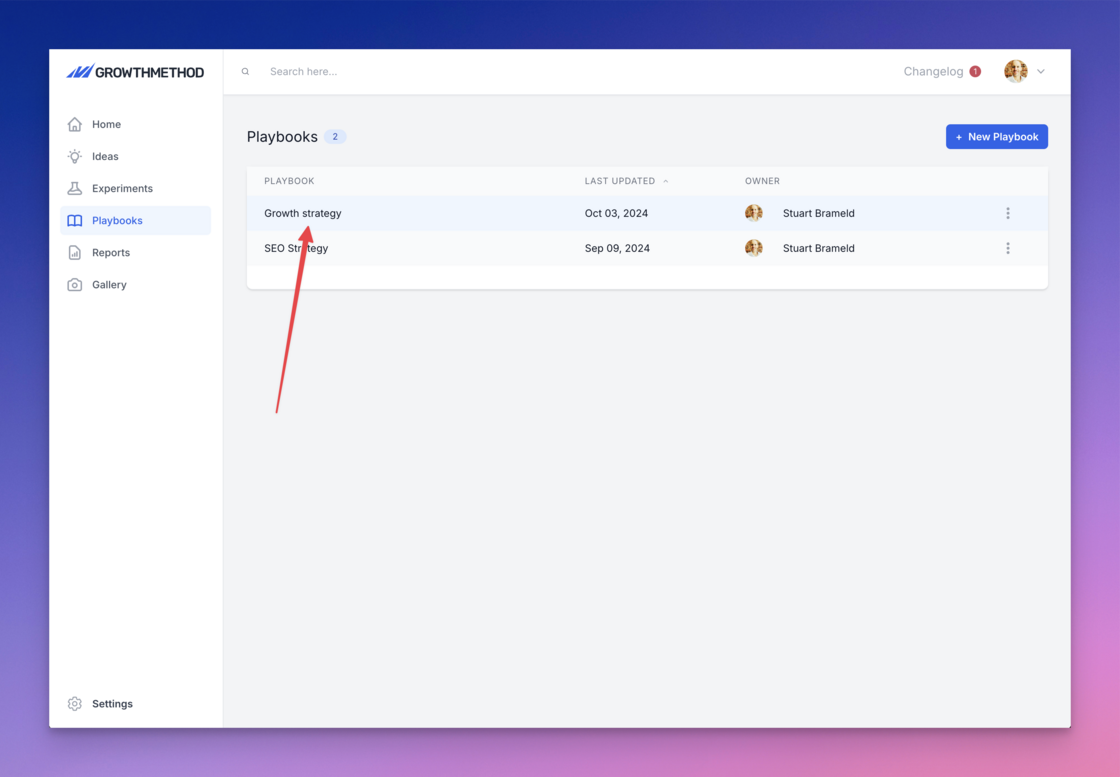
Reassign experiments.You can now Reassign experiments from actions menu: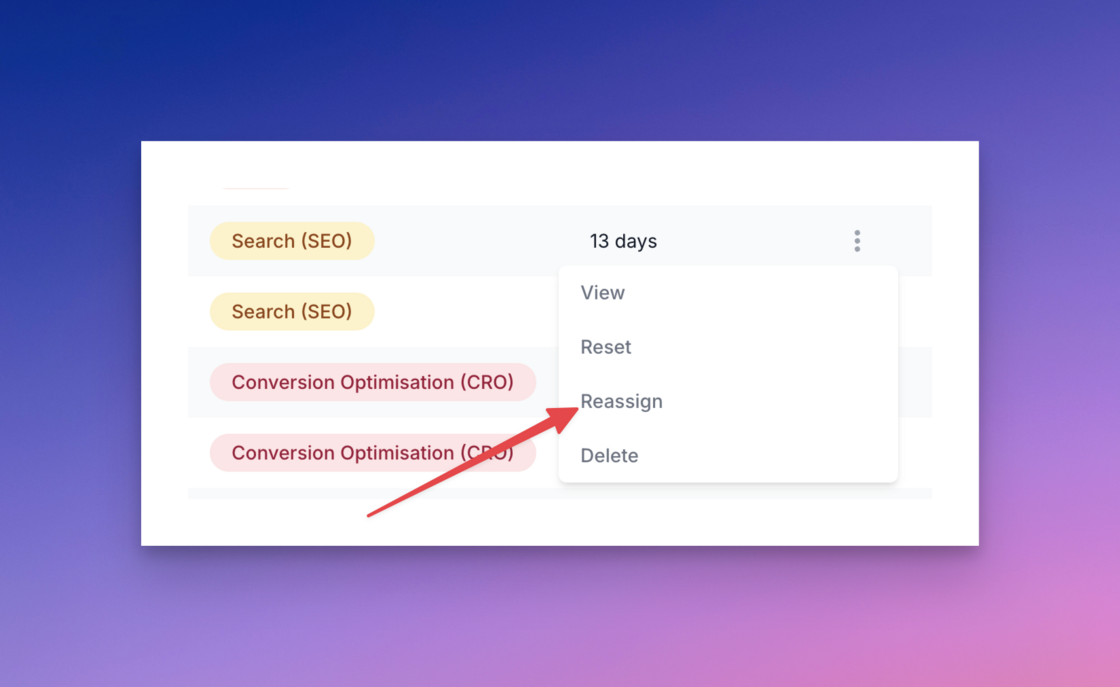
Updated growth team activity report.Our updated growth team activity report is now live and tracks key growth activity for the selected period.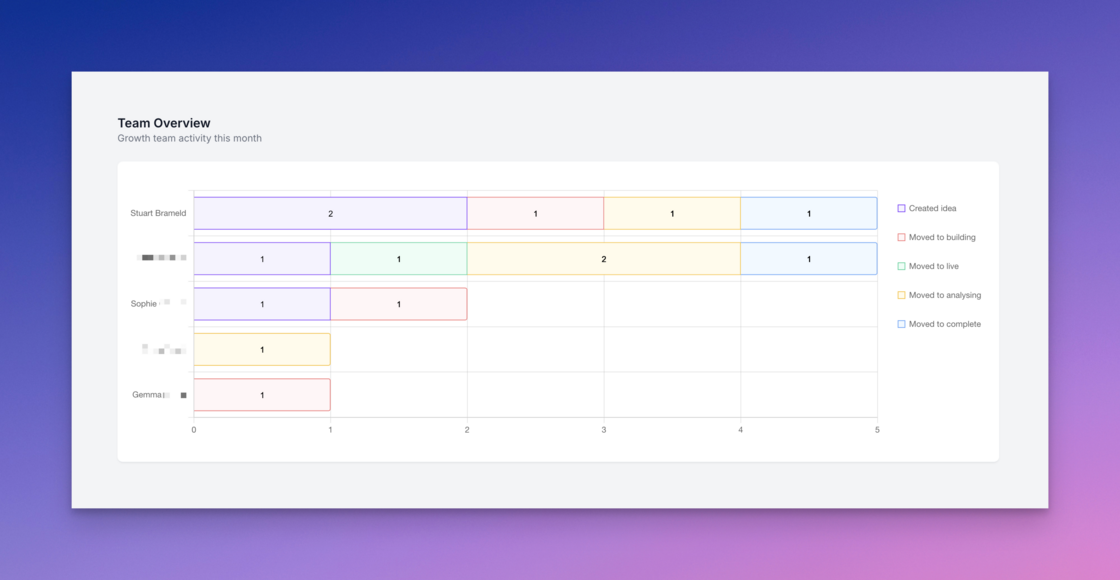
Upload up to 20MB files.A small but important update for those of you that upload large images and other files to your experiments. You can now upload files up to 20MB in size.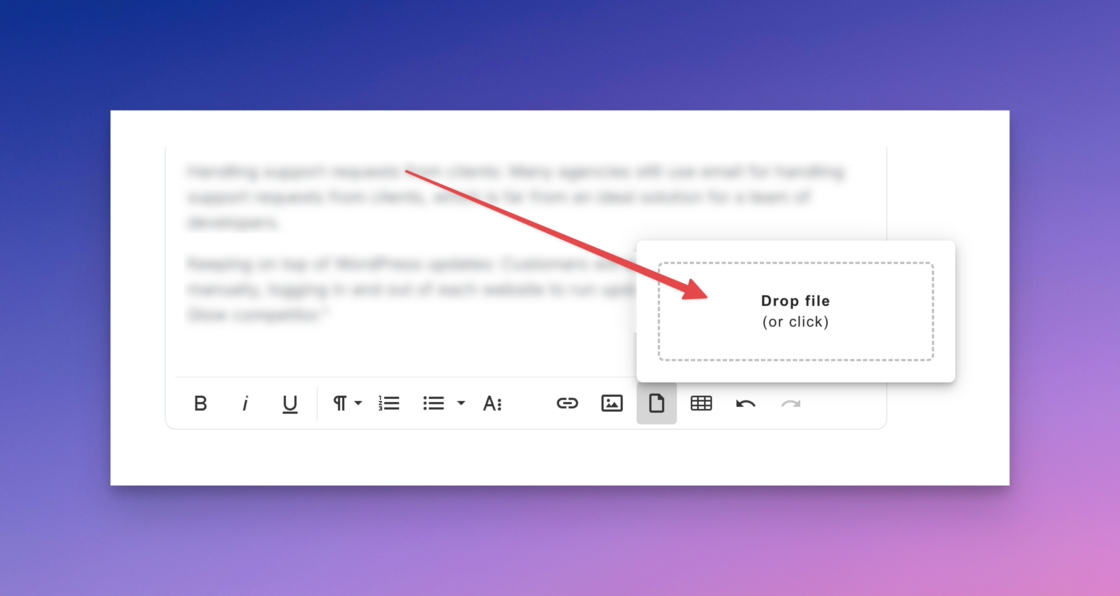
Removed experiment rating.After much debate, we’ve decided to remove experiment rating across all experiments.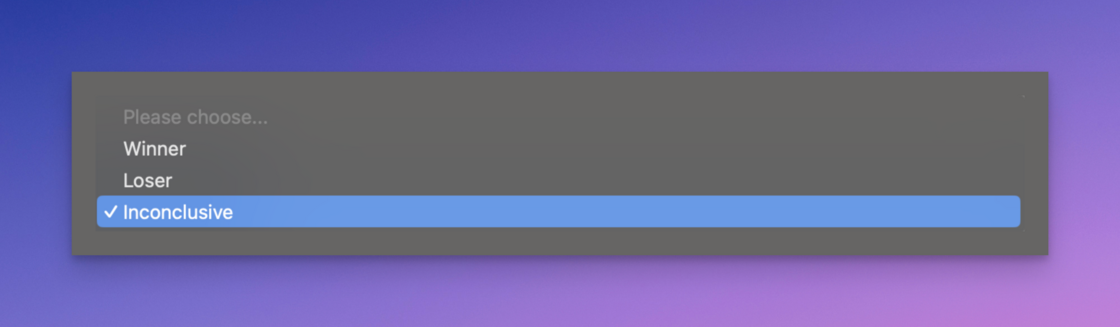
- Experiment rating is almost entirely subjective (“I didn’t meet the target of X, but did achieve Y, is it still a loser?”)
- Having to rate your work is inconsistent with the goal of learning regardless of the outcome
- Nobody wants to assign ‘Loser’ to their own work There is much disagreement in the world of growth and marketing, but the one thing everyone agrees on is that if you have to focus on ONE thing, it should be testing velocity (aka speed ). We want our customers to optimise for learning (and therefore experiment speed and velocity) over everything else, and experiment ratings felt contradictory to that.
Various design improvements.We’ve shipped various small design improvements over the last week including:
- Increased line length for Ideas and Experiments in the tabular overview screens
- Improved formatting on shared links
- Added bullet style formatting to shared links
- Improved images alignment on shared links
- Added read-only quant results to shared links
Pinned growth strategy playbook.Every Growth Method customer has a playbook that focuses on strategy. For newer teams, this is created automatically from
our onboarding questionnaire
.
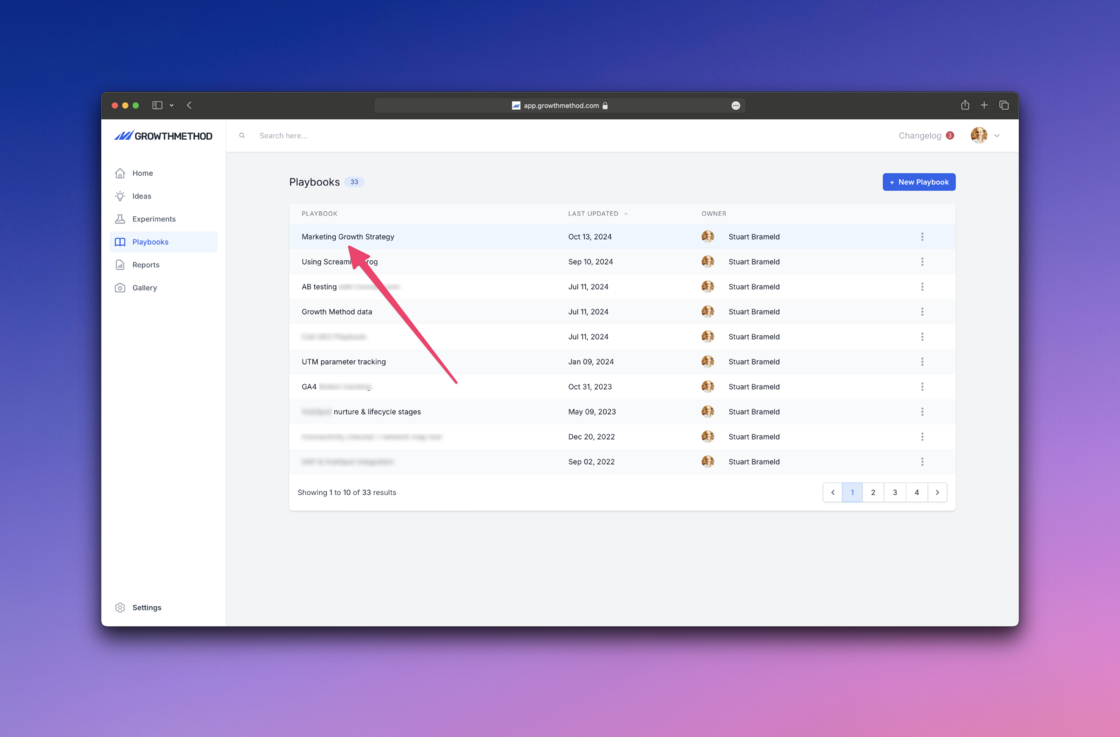
- Easy to find
- Understood by the entire team
- Continually reviewed and discussed As a first step to supporting this, your growth strategy playbook is now ‘pinned’ to the top of the playbooks area in Growth Method.
Improved chart display.The X axis on your main growth chart now aligns with your growth goal.
For example, if your goal is to reach 10,000 organic website visits, the Y axis will display 0 to 10,000 along with a sensible scale.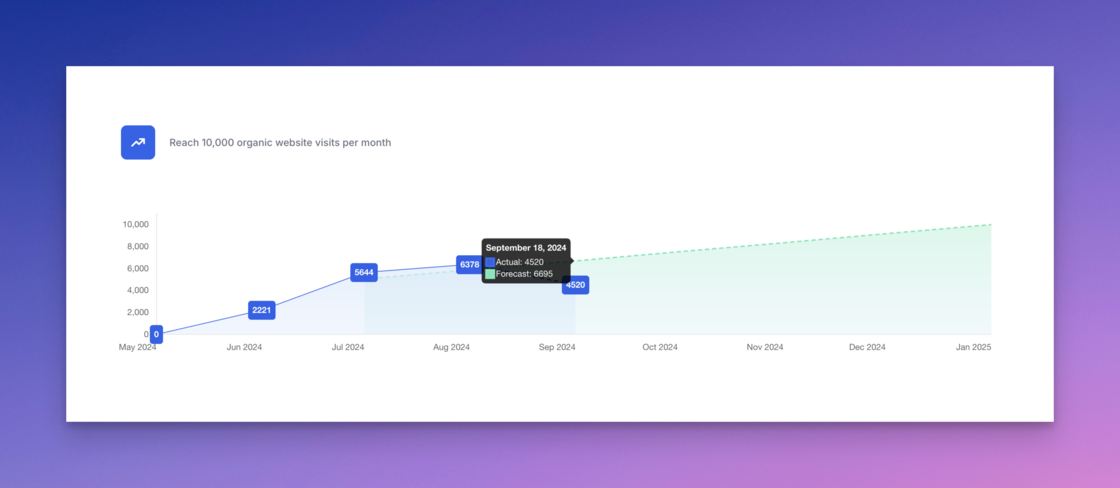
Idea context.The supporting text on ideas and experiments has been updated to reflect the change required for a 5% improvement to your primary growth goal.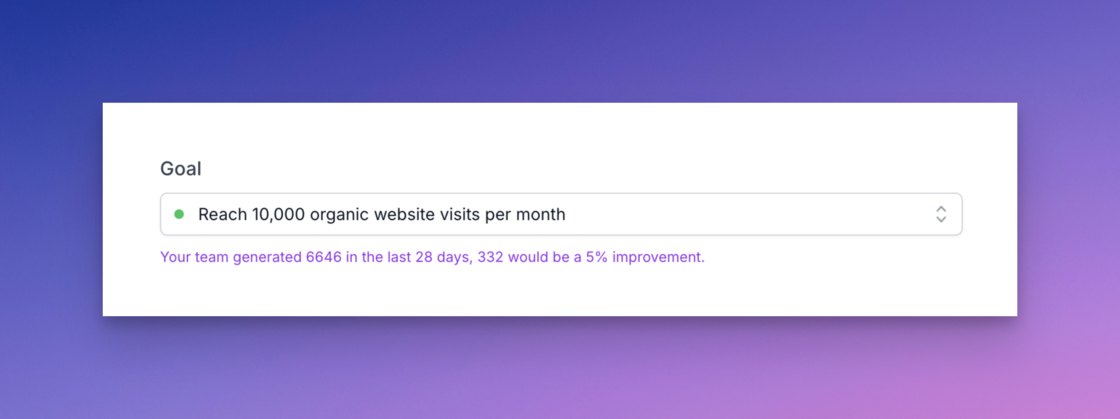
Adding quant data using AI.We believe that within the next 2 years the majority of marketers will access marketing analytics data via natural language interfaces (not traditional web analytics interfaces).
We wrote about this recently here:
https://growthmethod.com/ai-in-marketing-analytics.
In order to prepare for this new world we have added a new ‘AI’ button next to the (manual) ‘Add Result’ button for some accounts.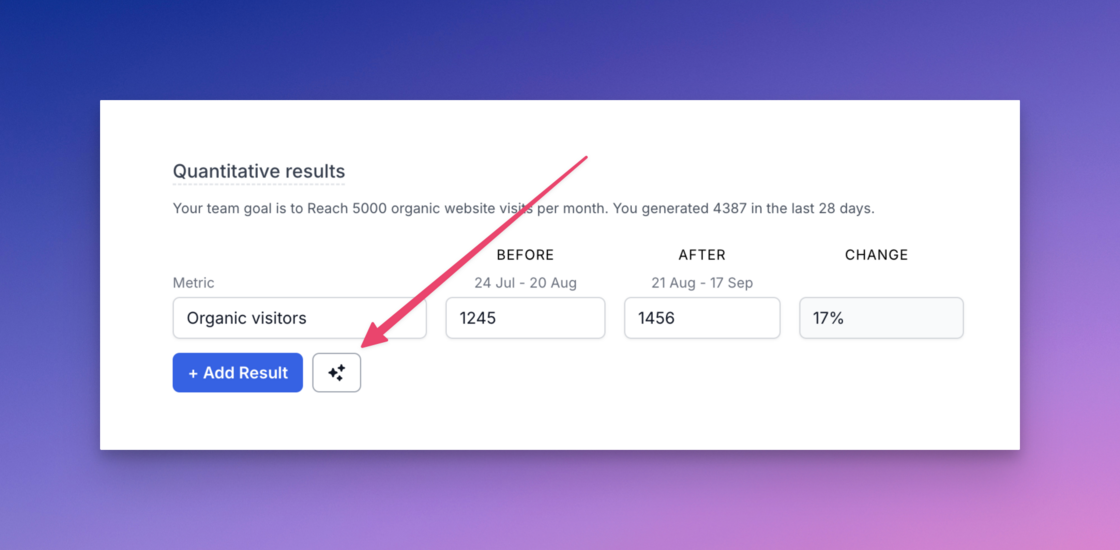


- Click the AI sparkle button to open the modal
- Type the data you want into the text field (or use a pre-prepared prompt)
- The AI builds the relevant API query for your request
- The API query is sent to your analytics provider (including the specific experiment dates)
- The returned data is populated in your experiment results (along with a tooltip showing the API query)
- When moving to the Analysing stage automatically the query is re-run and experiment results are updated automatically We also provide full details of the API request that was generated on-the-fly and used to request the relevant data.
Adding quant data manually.We’ve made it easier for anyone to record any quant data on experiments:
- Click the Add Result’ button to add a blank row (the ‘Before’ and ‘After’ dates will be preset for you)
- Add a name for the data you are adding (for example Organic visitors, Conversions, Impressions, CTR)
- Enter the relevant data and we’ll calculate the % change for you automatically Hovering over a row displays a trash icon at the end of the row should you need to delete it. Note: if you create a new version of an experiment we’ll automatically copy the same metric names to the new version for you.
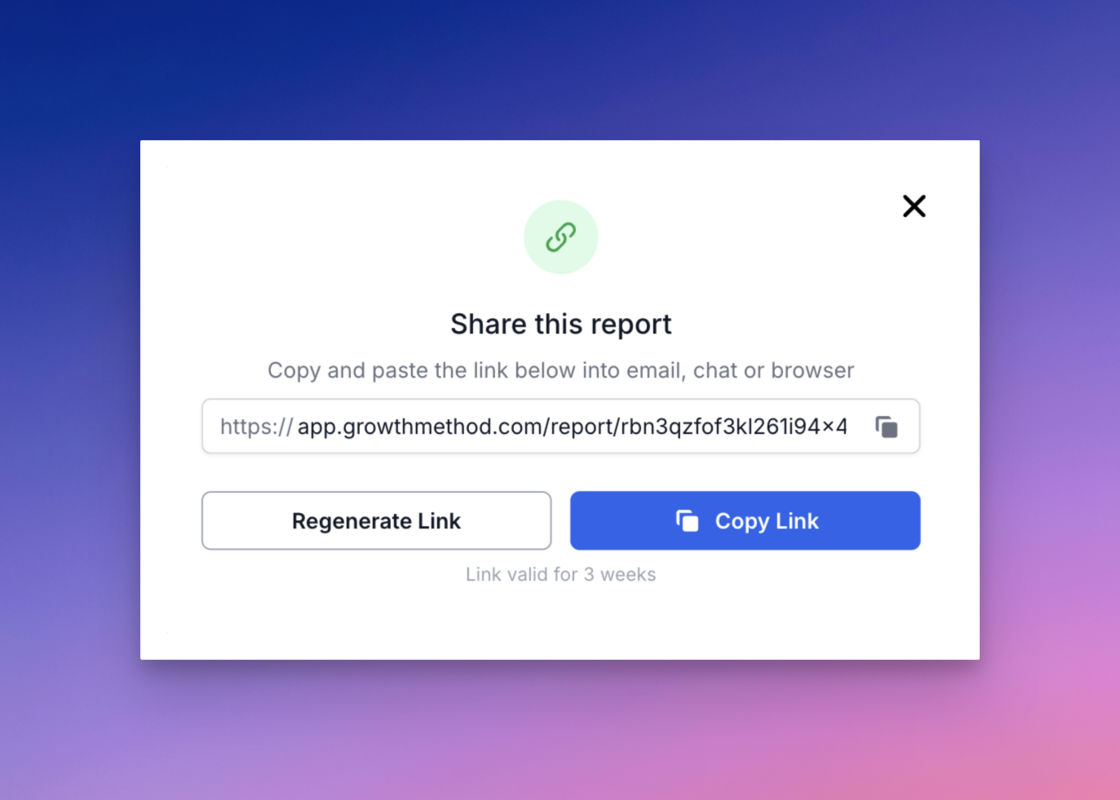
Shared reports now available.You can now share team reports and showcase the work your team is doing with others inside or outside of your company.
Click the new ‘Share’ icon at the top of the reports page (
https://app.growthmethod.com/reports)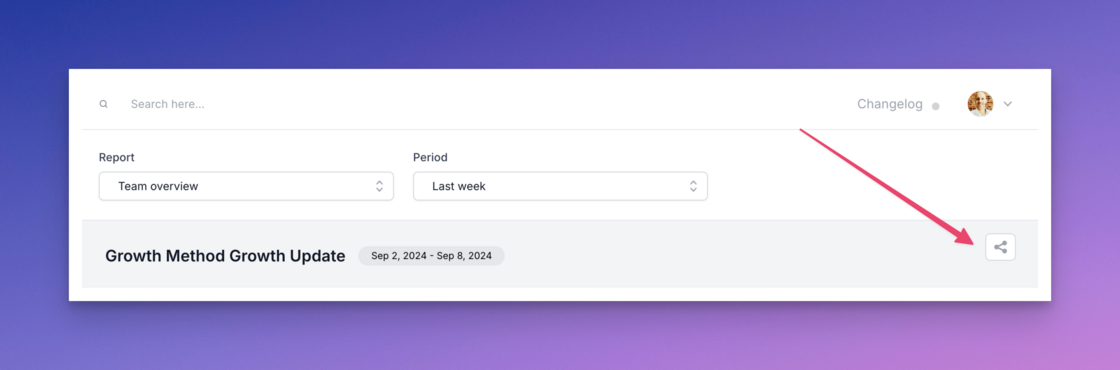
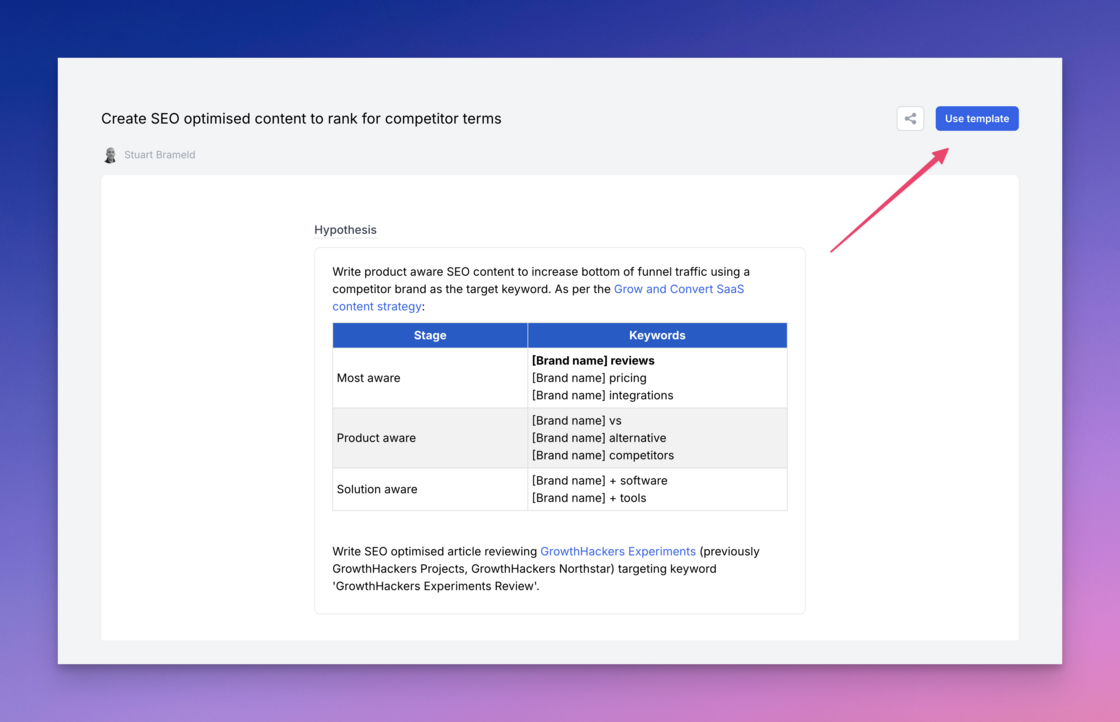
Experiment templates.Not only are we starting to add to the public gallery of experiments, but you can now use these as templates for your own experiments.
New idea notification.In order to encourage feedback and discussion, new idea notifications to team members now include the following text:
“Click reply to provide further details or suggestions that may help make this a success.”
macOS font improvement.macOS users will notice all text within the platform looking more sharp and crisp as of today.
Improved date handling for integrations.We have expanded the allowed date formats for data integrations from 3rd party tools such as Hubspot, Salesforce, PostHog, Google Analytics etc.
Previously dates had to adhere to the YYYYMMDD format e.g.We now accept any of the following date formats:
- 20240413
- 2024-04-13 (the ISO 8601 standard)
- 2024-04-13T15:45:30.123Z
Own tab removed.The Own tab has now been removed given it is no longer required with the addition of the new toggle added in
our recent platform update
.
Weekly growth report enhancements.You will notice 2 small improvements in your next weekly growth report (sent every Sunday at midnight).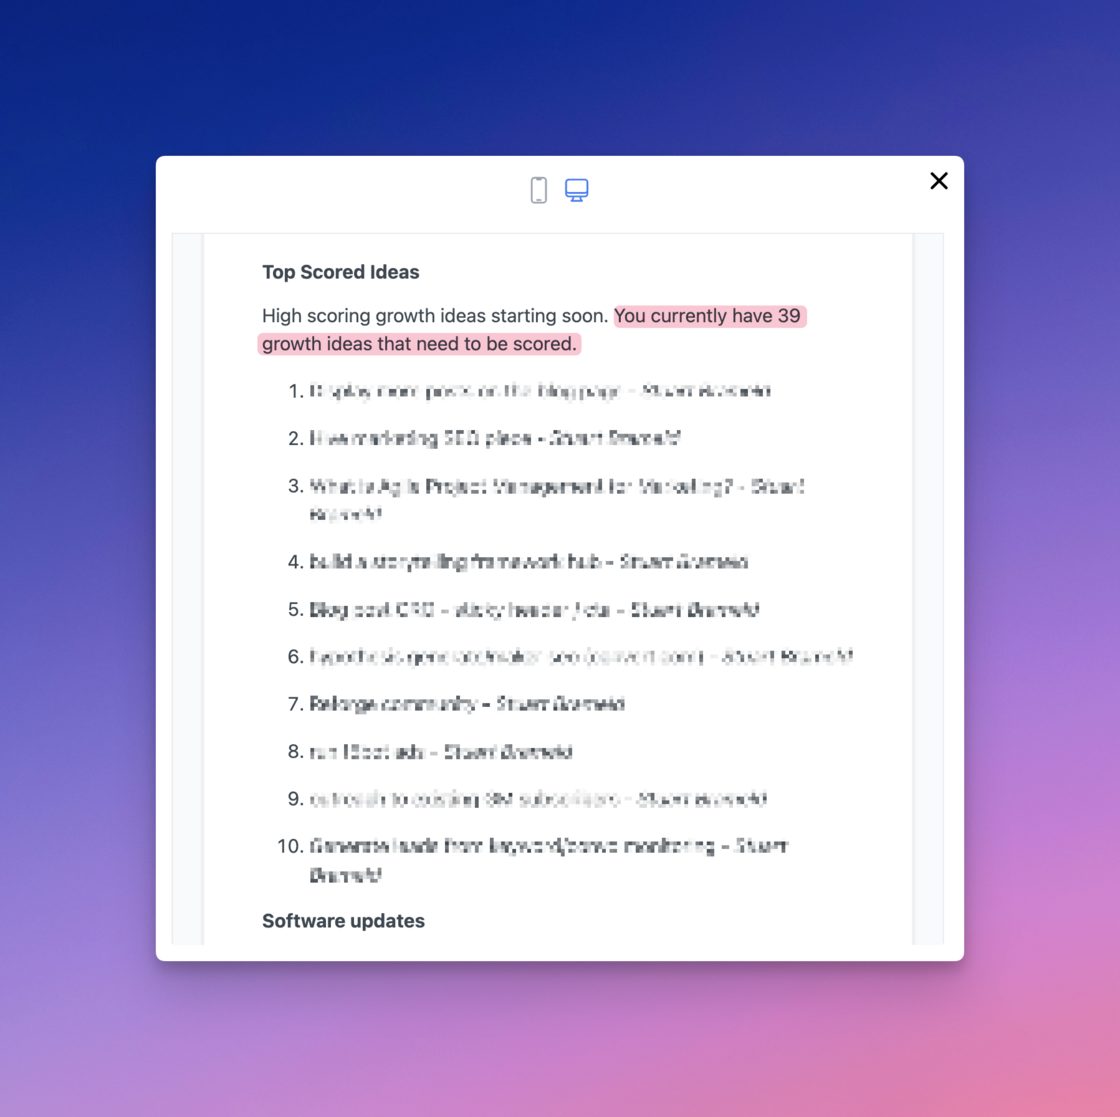

- A count of your unscored growth ideas is now included in the report as a reminder to complete the scoring process with your team.
- A new ‘Software updates’ section towards the bottom of the report links to the Growth Method Changelog where you can read about new platform updates.
Required fields warnings.Required field warnings are now shown before all modal windows when moving to a later experiment stage.
Report time periods updated.Reporting time periods have been reordered from shortest (most used) to longest (least used) as below.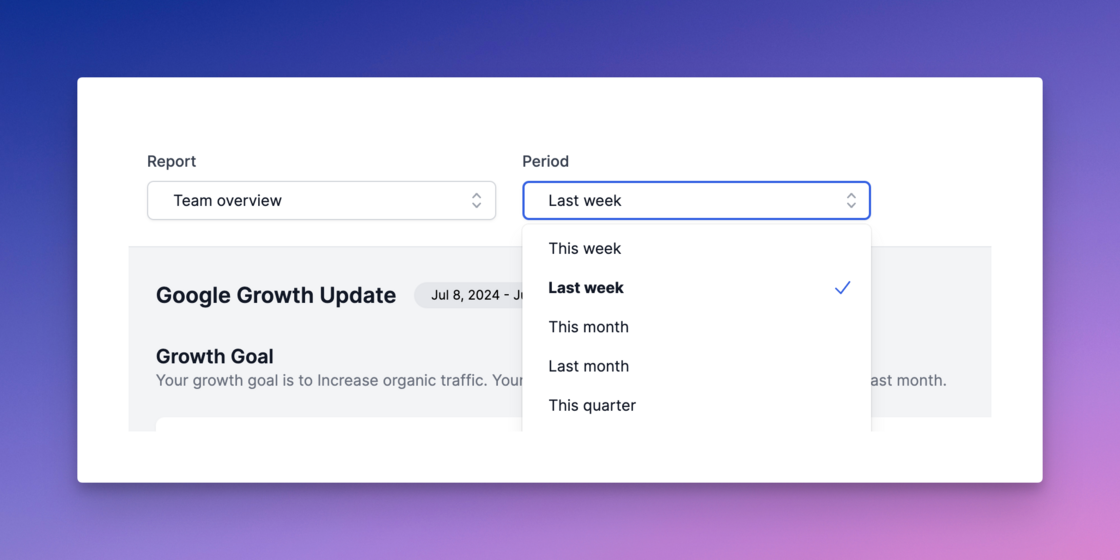
- This week
- Last week
- This month
- Last month
- This quarter
- Last quarter
- This year
- Last year
- All time
Unscored ideas in growth report.Your weekly growth report now includes any unscored ideas that need to be scored.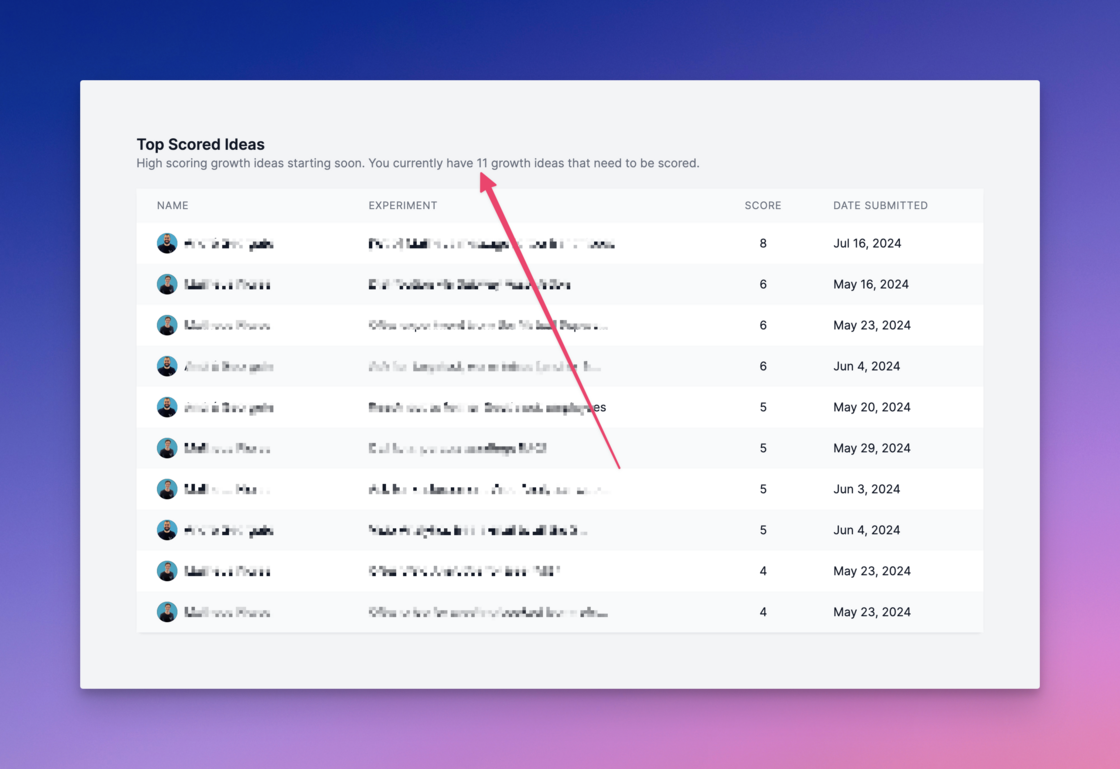
Improved experiment sharing.Public experiment links (shared links) have been updated to include both qualitative and quantitative results sections.
Channel sparkle icon.A new sparkle icon on the channel column heading indicates that these classifications are now AI driven, removing the need to manually classify your experiments.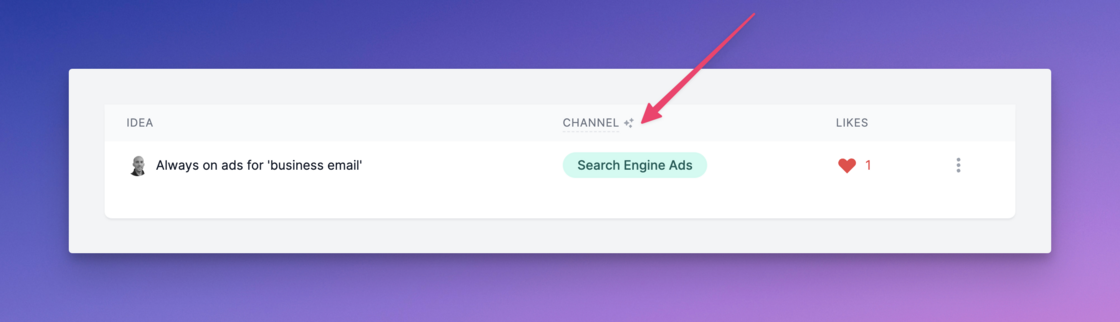
Platform update.This weekend we moved to a completely new build of Growth Method. For now it will look and feel similar to what you’ve come to expect, although you’ll notice the application is faster, more responsive and more polished.
Under the hood however, everything has changed. The entire codebase has been rewritten from scratch paving the way for lots of new functionality that will be rolling out over the coming weeks.
Some small updates and changes that are part of this initial release:

- Homepage graph We’ve added values to the dashboard line graph for your main growth goal to make it easier to read at a glance. You can still hover over any point to see actual vs forecast.
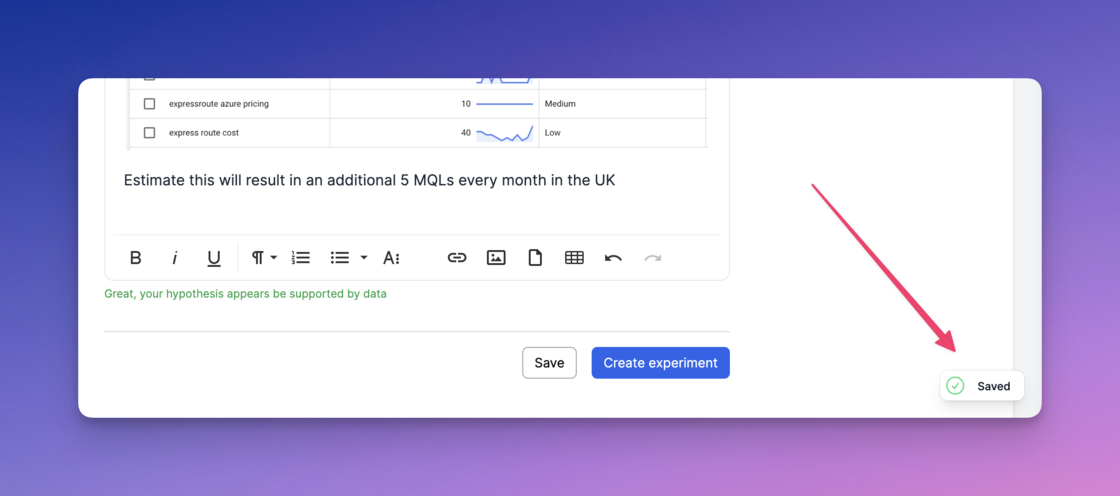
- Autosave Autosave has been added in all areas of the application. Now when you forget to save something after updating an Idea, Experiment or Playbook, we’ve got you covered.
- Email preview You can preview the Weekly Growth Update under the Subscribers tab in your team settings. This includes all AI generated experiment summaries and publicly shareable links we generate on-the-fly for stakeholders.
Tooltip to help when choosing a metric.One of the biggest challenges we see new teams struggle with is selecting good metrics and goals. The new tooltip available when creating or editing a goal links to an article on north star metrics, OKRs, KPIs and how to think about goals and metrics more generally.
You can
read the article here
.
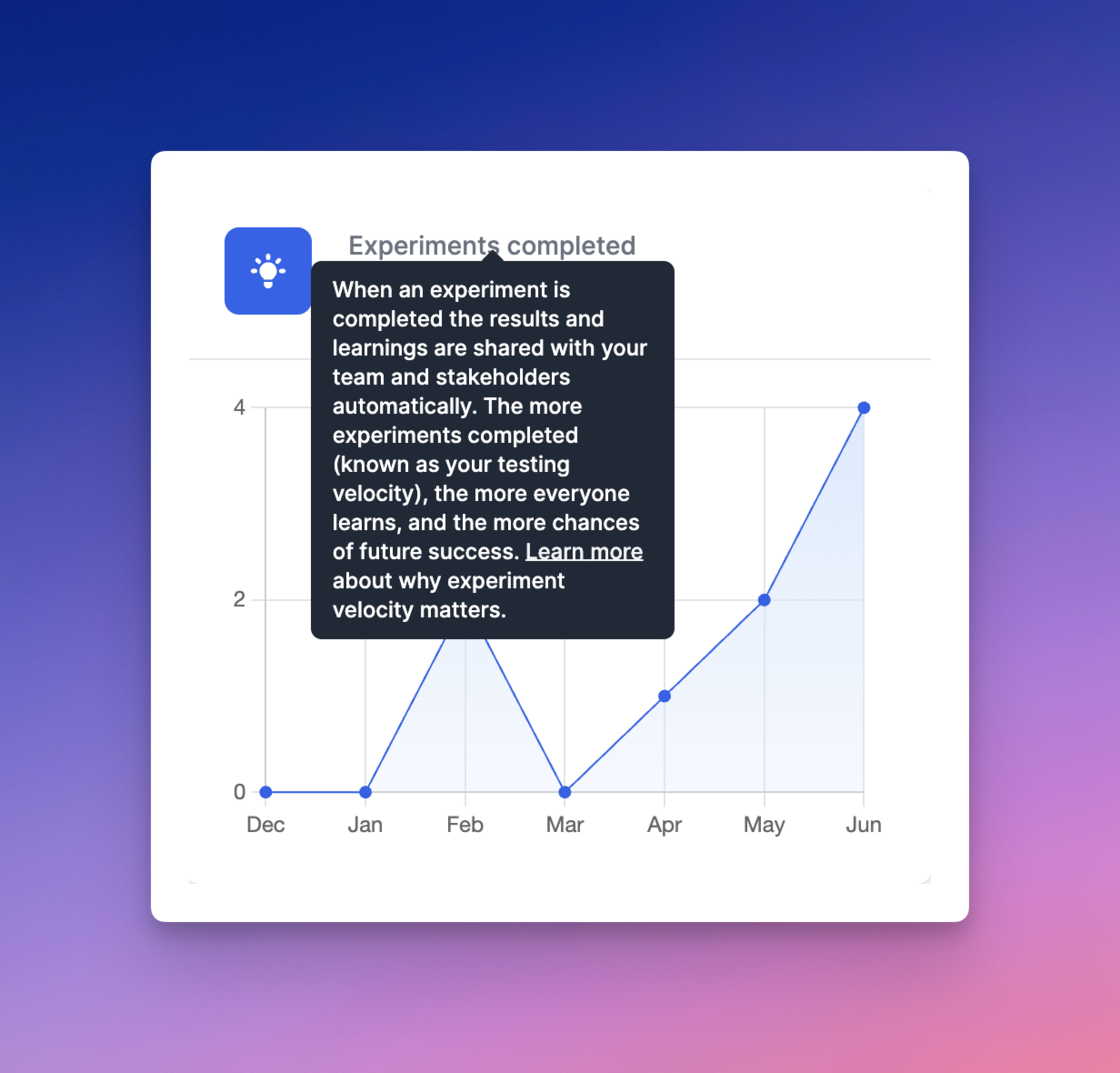
Experiments completed tooltip.A new tooltip has been added to the ‘Experiments completed’ text on the dashboard linking to an article on experiment velocity.
Read the article at
https://growthmethod.com/testing-velocity/
.
Expanded AI summaries.AI summaries are now created when experiments are started, as well as when completed, enabling additional AI summaries to be included in growth reports.
Growth goal updates.We now include your goals target value and last month actual value in your weekly report.
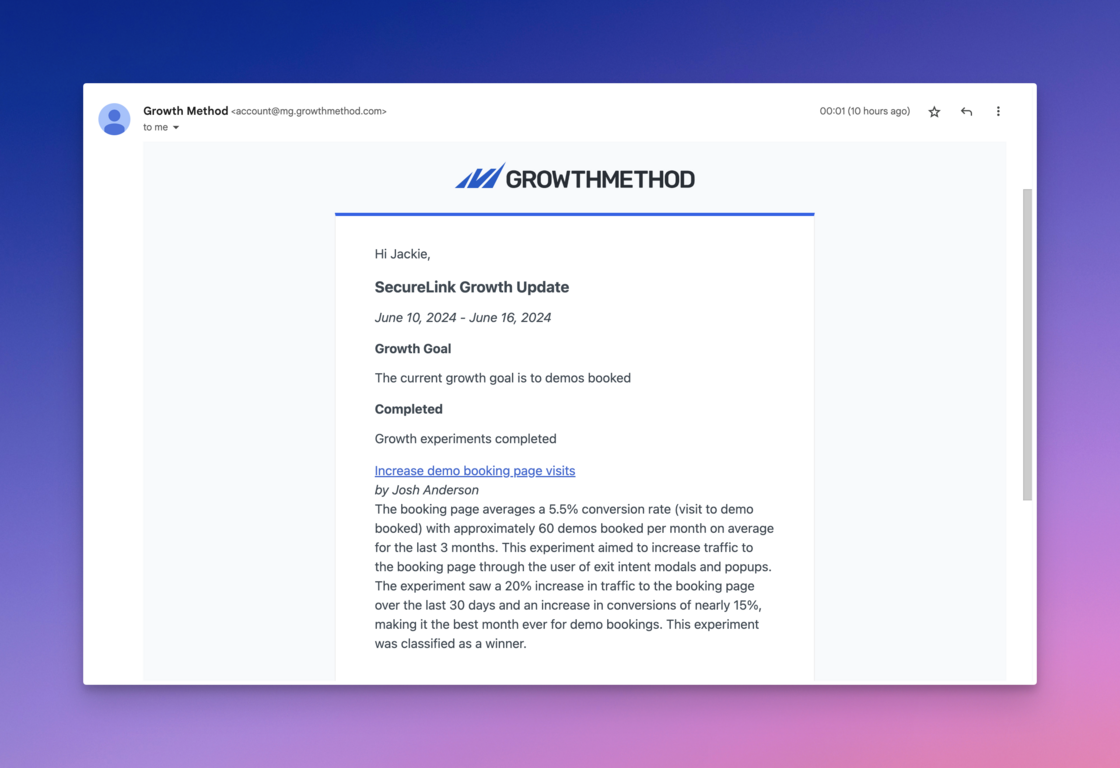
✨ Automated weekly updates.Automated reports now make it easy to update the whole company on growth work.
The Weekly Growth Update is sent every Monday and includes:
- Your current growth goal
- Summaries and links to completed and live experiments
-
High scoring growth ideas starting soon
Completed and live experiments are summarised using the latest OpenAI GPT-4o model.
AI Summaries in reports.AI summaries are now included in reports for all completed experiments, powered by GPT-4o.

Quant & qual tooltips.New tooltips and linked articles have been to further explain qualitative vs quantitative results and data (tooltips and links below).
AI model update.We are now using GPT-4o for all AI functionality, including experiment categorisation and experiment summaries. For more details on this new model see
https://openai.com/index/hello-gpt-4o/
.
In testing we have found GPT-4o to be both significantly faster, and more concise.
Automatic subscriber settings.To keep wider teams and stakeholders informed of growth activity teams can add new subscribers manually, or people can subscribe automatically from shared links.
Your shared link subscription settings are now visible within the app.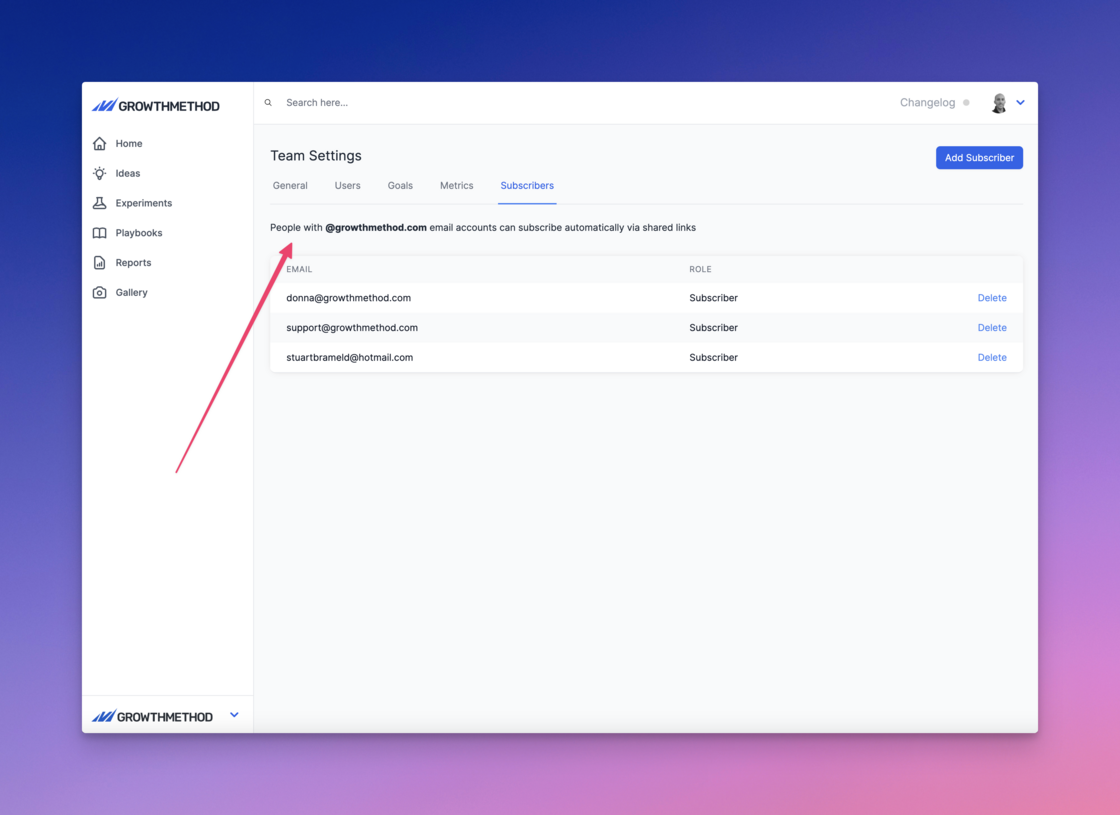
Dedicated webhooks.Customers can now use a dedicated webhook URL and token for data integrations with Growth Method. This is for customers that either:
- Wish to manage integrations themselves
- Have specific security requirements
- Have many complex integrations Please contact support@growthmethod.com should you require this as it is not currently configurable via the UI. Note: we recommend using a 128-bit v4 UUID for webhook security tokens.
Updated team report.The team report has been updated and is now the default report when selecting ‘Reports’.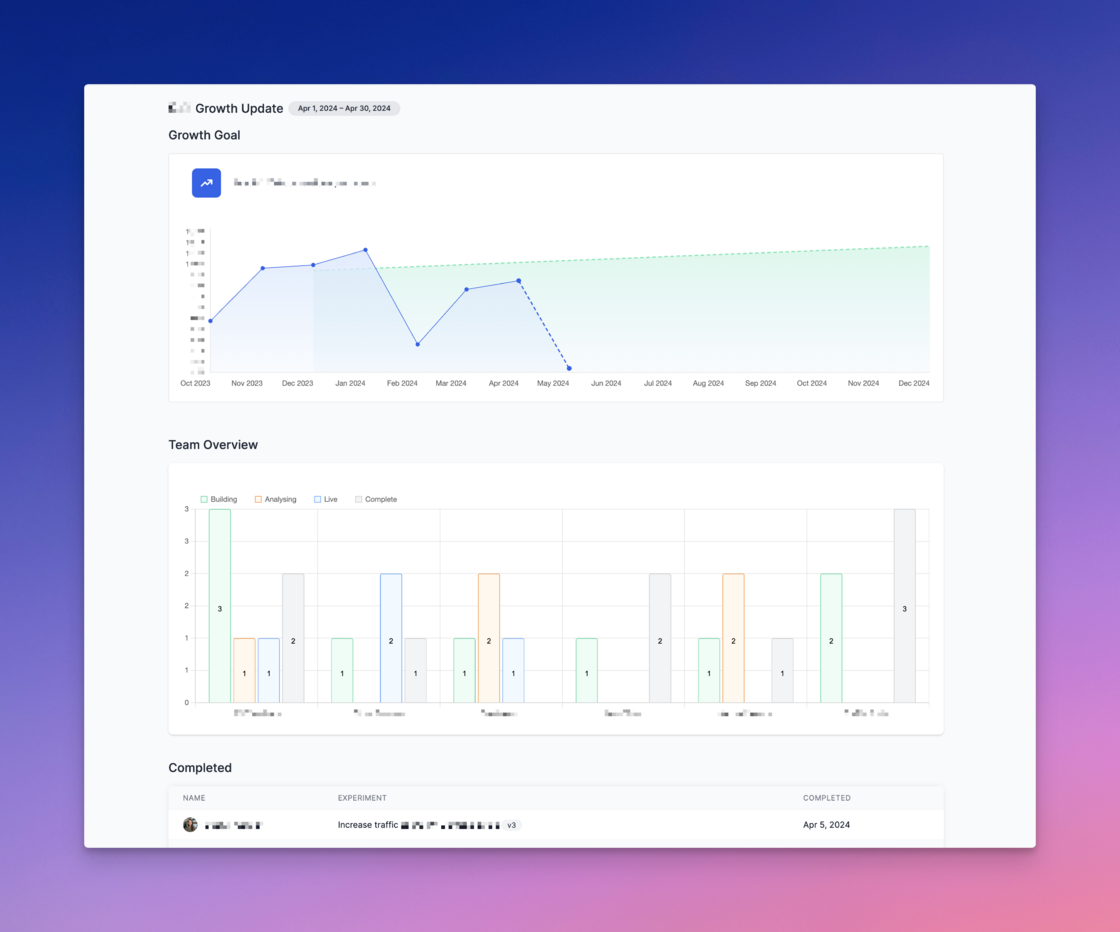
- Growth goal
- Team overview
- Completed experiments
- Live experiments
- Top scored ideas If no experiments exist for a specific stage the following text is displayed: There are currently no experiments in the [stage name] stage” Note: Only experiments in the Live and Completed stages are shown in team reports inline with our outcomes over outputs approach to growth.
Auto move to analysing.Live experiments are now moved to analysing automatically after 28 days and a notification is sent to the experiment owner as below:
AI-powered categorisation.The categorisation drop-down has been removed from the new idea screen as we are now using AI to auto-classify your growth ideas.

The AI “Sparkles” icon.The new “Sparkles” icon indicates where we are using AI to assist your workflow, such as in automated experiment summaries as below.
Profile pictures in list views.Experiment owner profile pictures are now shown in all views so that you can easily see who is working on what at a glance.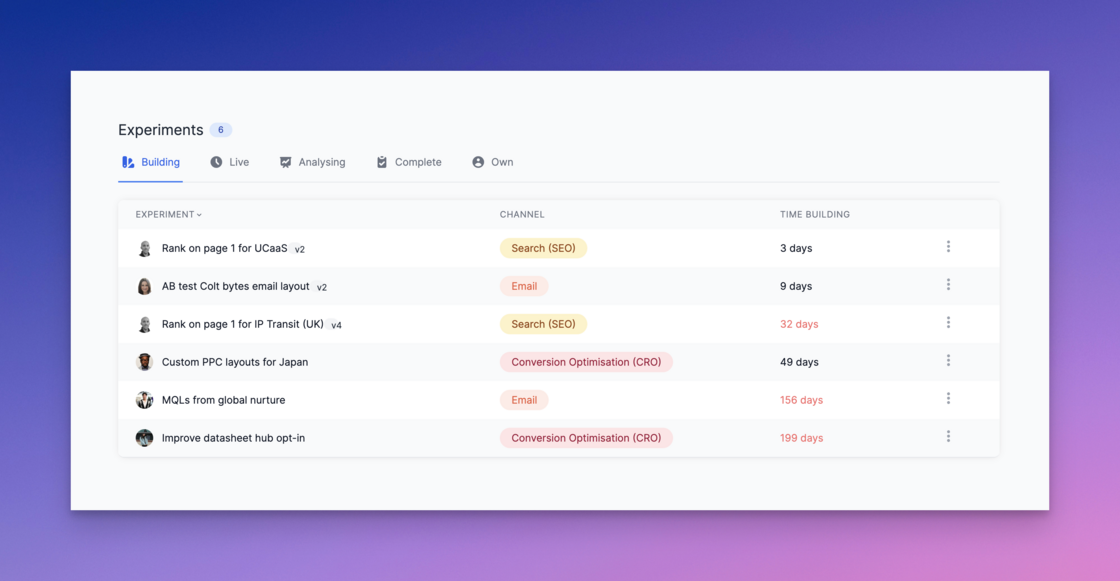
Standalone metrics.There are now 2 kinds of metrics in Growth Method: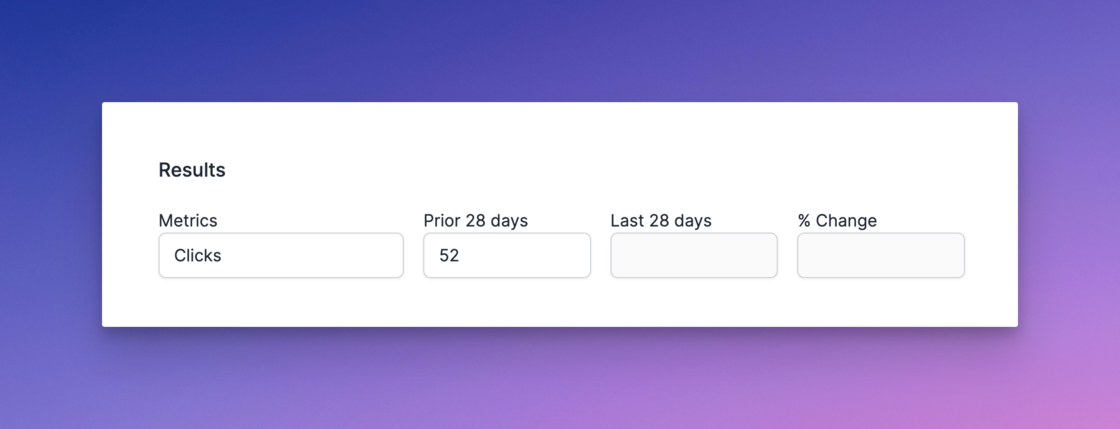


- Business Metrics
- Experiment Metrics We’ll explain how these cover all of the reporting requirements for your growth marketing team below. Experiment Metrics Experiment metrics are used to store the detail from individual experiments, numbers such as Clicks, Conversions and Conversion Rate. They are the numbers your marketing or growth team care about on a daily basis.
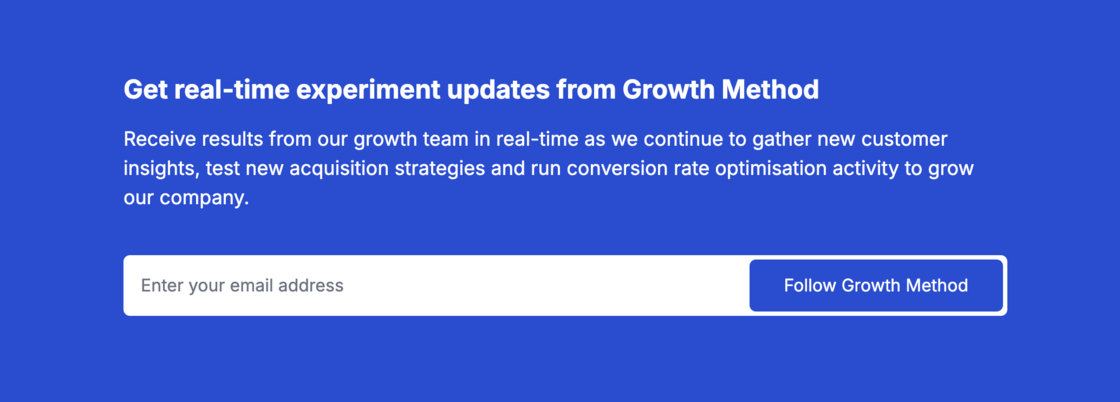
Manually add subscribers.Want to share your team’s impact and get feedback for new growth ideas?
Stakeholders have always been able to subscribe to team updates via the “Follow” functionality at the bottom of all shared links.

Switch accounts in seconds.We have added a new account switcher capability for growth agencies and growth consultants meaning all of your customers are just 2 clicks away.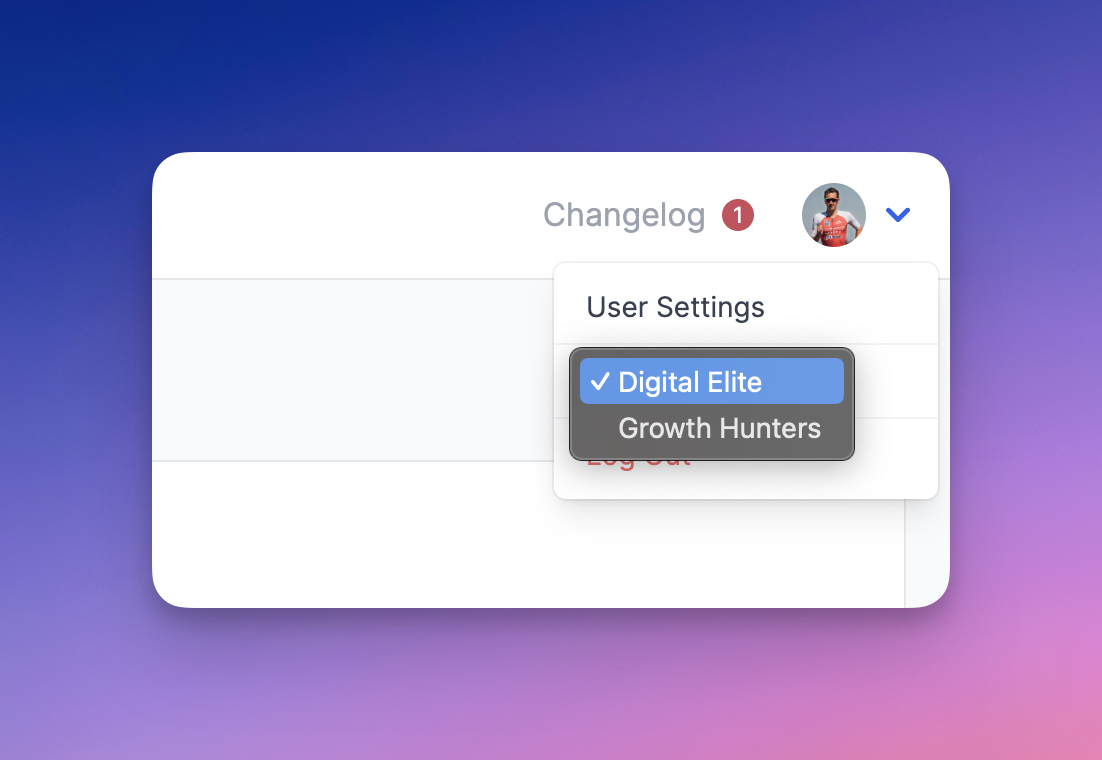
Experiment versioning order.Experiment versions are now listed in reverse chronological order with the most recent version listed first.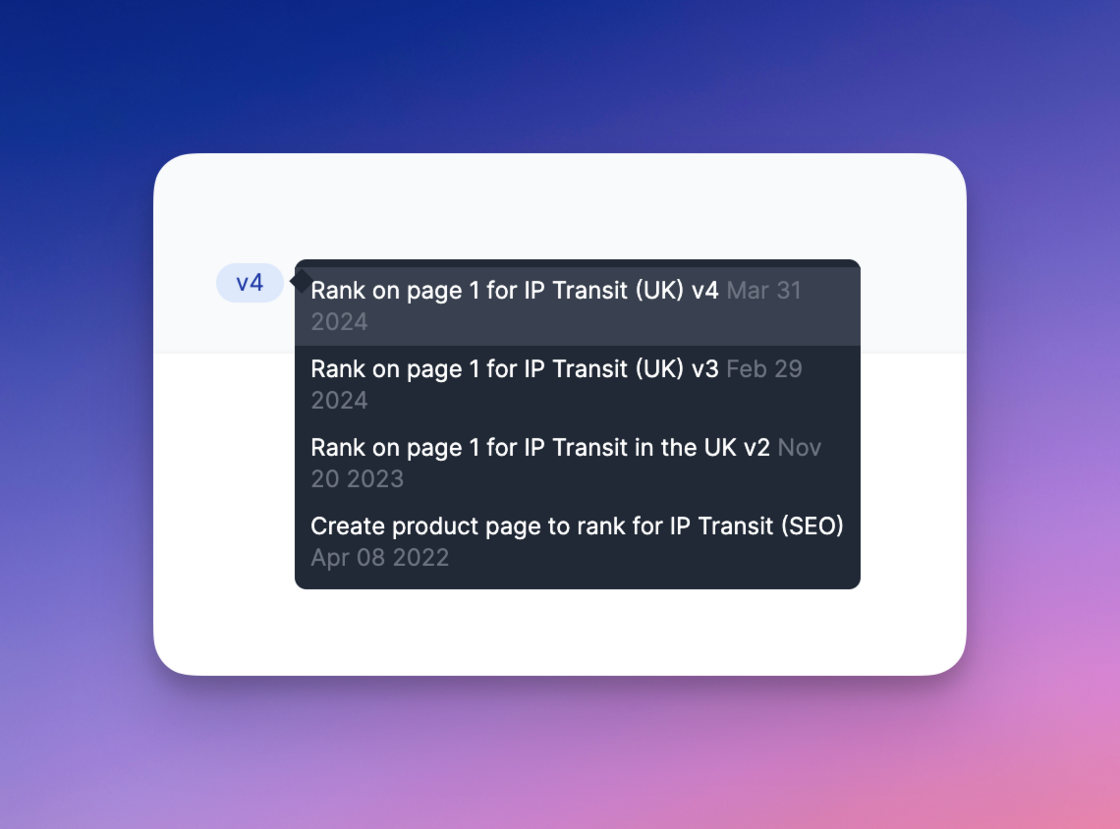
Sticky WYSIWYG editor.The WYSIWYG editor bar is now sticky in the playbooks area so that if you scroll down it remains pinned to the top of the screen. If you’re one of those customers that creates really long playbooks, this will make your life that little bit more enjoyable 😀
If you’re one of those customers that creates really long playbooks, this will make your life that little bit more enjoyable 😀Experiment stage names update.The In Design and In Progress experiment stage names have been updated such that experiment stages are now:
- Planning (previously In Design)
- Running (previously In Progress)
- Analysing
-
Complete

Update to default time period.A number of marketing analytics platforms, in particular Google Analytics, show the last 28 days of data by default.
The default time period for integrated metrics in Growth Method now also shows the last 28 days of data by default (as opposed to the last full month).
API request tooltips.The formatting of API query details has been updated to improve readability in tooltips.
Health score tooltip.We’ve added a tooltip to the health score with additional information explaining how this is calculated.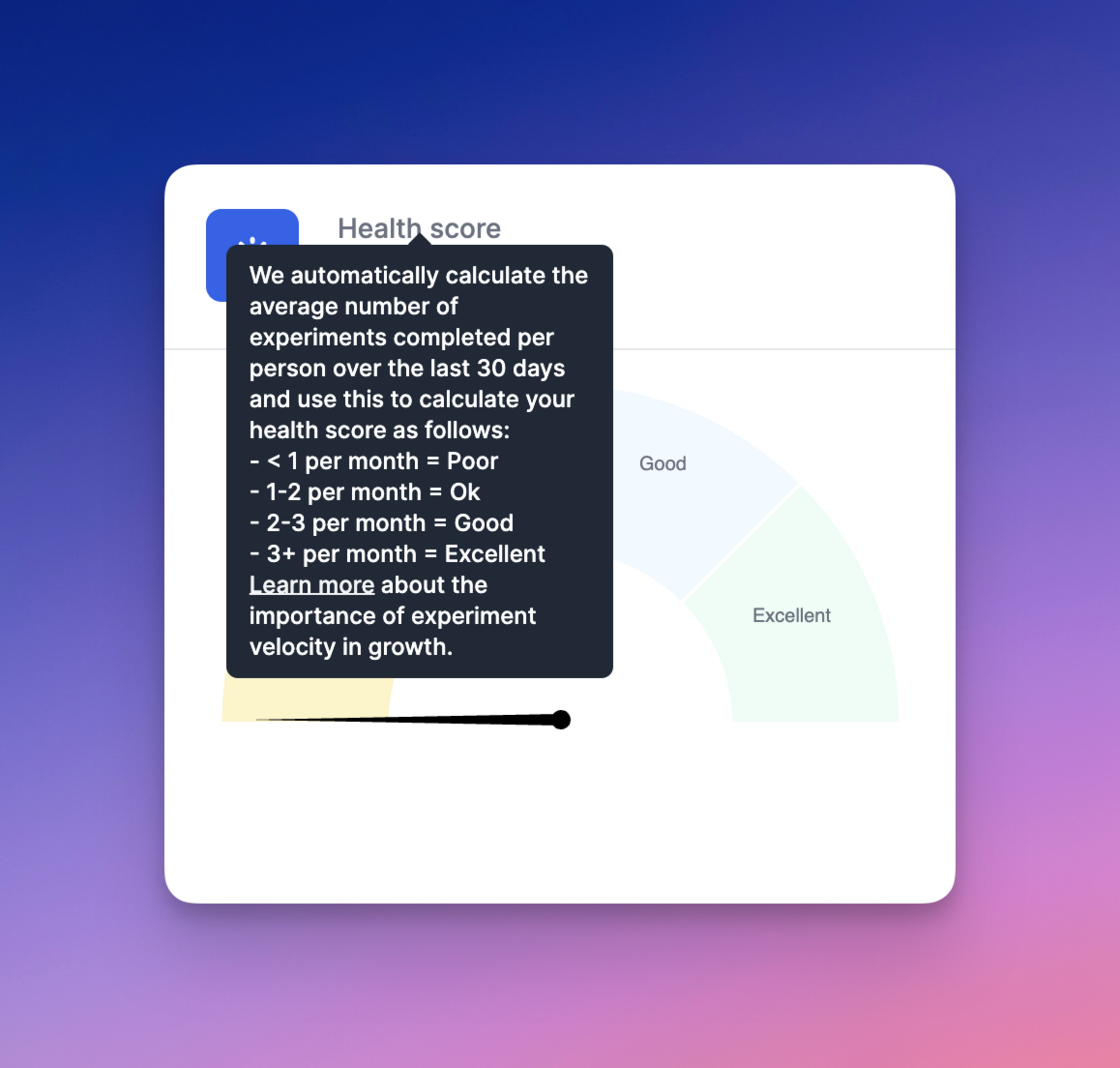
- < 1 per month = Poor
- 1-2 per month = Ok
- 2-3 per month = Good
- 3+ per month = Excellent Learn more about the importance of experiment velocity in growth.”
AI generated experiment summaries.Growth Method now creates AI generated summaries of experiment complete notifications which are used in email notifications to team members and followers.
You will see ‘Summary (AI generated)’ where OpenAI has been used.
Versions on Recently Completed.The Recently Completed widget on the homescreen now includes experiment version numbers.
Enhancements to goals.We have shipped a number of enhancements to goals as follows:
- A team can now have more than one active goal
- One goal is always identified as the primary (team) goal
- Goals can be assigned to users, or multiple users
- When creating a new idea or experiment, a user will see their assigned goal by default