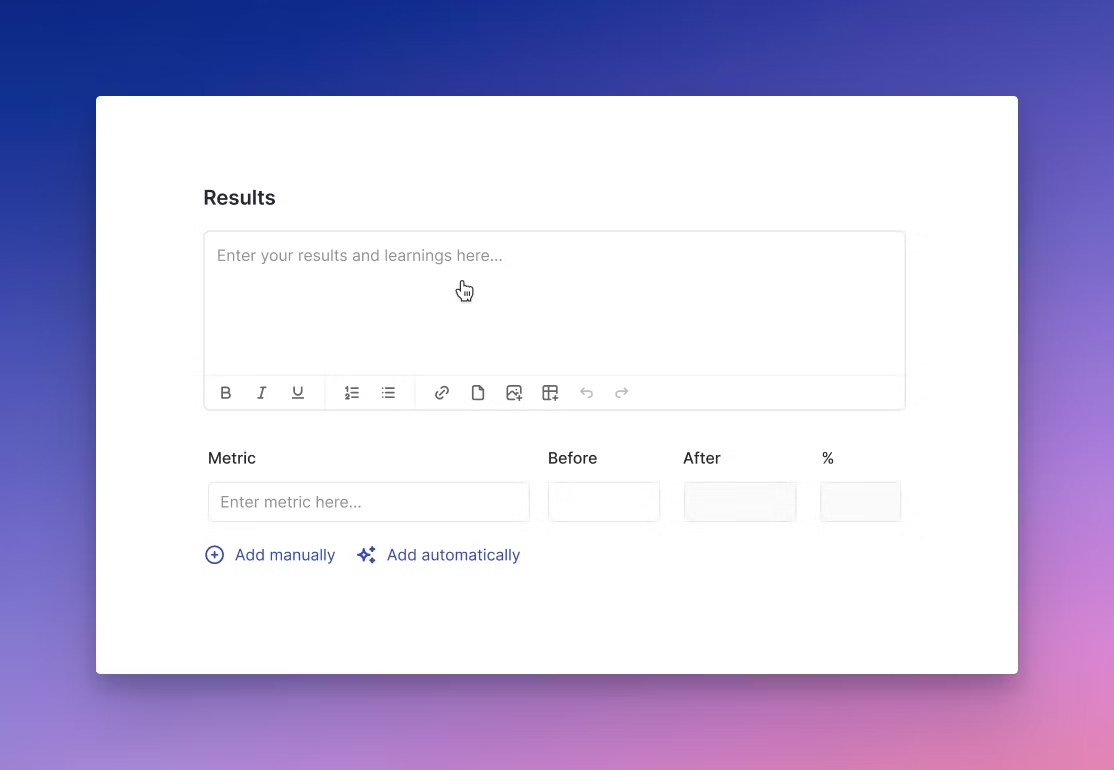
- Rich text field for entering narrative results, observations, and learnings.
- Metric tracking table to log key performance indicators (KPIs), showing before and after values, along with automatic percentage change calculations.
- Manual or automated entry options for flexibility — users can input data themselves or sync it from integrated analytics sources.
- Simple, intuitive design that supports storytelling alongside data reporting.
Positive signals
Not every campaign can be directly correlated to business outcomes and goals. Results and metric tracking enable team members to provide context and positive signals to determine if early “v1” campaigns are moving in the right direction.Campaign metrics
There are 2 options for adding data to your campaign results in Growth Method:- Add manually (the default)
- Add automatically
| Platform | Start Date Included? | End Date Included? | Timezone basis | Notes |
|---|---|---|---|---|
| PostHog | ✅ Yes | ✅ Yes | Project timezone | Retention: end date limits only the start event. |
| GA4 | ✅ Yes | ✅ Yes | Property timezone | Comparison ranges auto-match number of days. |
| Mixpanel | ✅ Yes | ✅ Yes | Project timezone | Retention windows count from event time, not date range. |
| Amplitude | ✅ Yes | ✅ Yes | Project timezone | End date includes events until 23:59:59. |
Automated Metrics (BETA)
We believe within 2 years the majority of marketers will access marketing analytics data via natural language interfaces (not traditional web analytics interfaces). We wrote about this recently here: https://growthmethod.com/ai-in-marketing-analytics. Automated metrics leverage natural language and AI to automatically retrieve data from your marketing analytics tools and update your campaign data automatically.| Stage Change | Metrics Action | Example |
|---|---|---|
| Building | Populate the prior period | |
| Live | Refresh the prior period | |
| Analysing | Add current period and calculate the change | |
| Complete | Set all metrics to read-only |